39
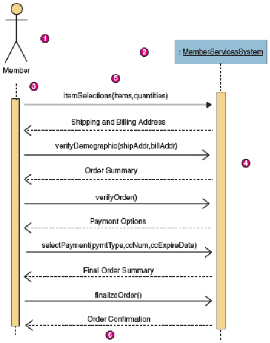
Image 2.13 Sequence Diagram Illustration
(Source: System Analysis and Design Method – Whitten and Bentley,
2007)
2.2.1.4.
Activity Diagram
Activity diagram is a diagram that is used to graphically show
the sequential flow of activities of a business process, the step use case
or the logic of an object behavior (method). Activity diagrams also can
be used to represent sequence, selection and iteration and they can also
illustrate where different activities can be carried out in parallel.
(Whitten and Bentley, 2007)
Activity diagram consists of:
1.
Initial Node
An activity diagram
is started by solid circle as representation of
start point.
2.
Actions
All actions and running process in activity diagram is symbolized by
a rounded rectangle.
3.
Flow
Every progress for each action in activity diagram is indicated by
arrows which are usually stated without any words.