 CHAPTER 2
LITERATURE REVIEW
2.1. Diversification Strategy
Product/Service
Alternatives
Market Alternatives
Reduced
Product/Services
Reduce Market
Existing Market
Expanded
Market
New Market
Market
diversification
Existing
Product/Services
Modified
Product/Services
Product
diversification
Market and
Product
diversification
New
Product/Services
Figure 1: Competitive Position Growth Alternatives ( Woodcock & Beamish, 13: 2003 )
Diversification is a part of corporate-strategy (Hill & Jones: 2001; Pearce II & Robinson:
2003; Hit et al: 2007). Diversification inside corporate strategy level means this option
may bring the future direction of the company.
2.2. Reasons for diversification
Every strategy always has
reasons
because strategy
would
be
used
by
the
company
to
fulfill its goals. Reasoning is a basic-concept for effective-strategy. Hit et al (173: 2007)
explained some reasons why a company uses diversification-strategy
|
|
2.2.1. Value Creating Diversification
•
Economies of scope (related diversification)
o
Sharing activities
o
Transferring core competencies
•
Market Power (related diversification)
o
Blocking competitors through multipoint competition
o
Vertical integration
•
Financial economies (unrelated diversification)
o
Efficient internal capital allocation
o
Business restructuring
2.2.2. Value Neutral Diversification
•
Antitrust regulation
•
Tax laws
•
Low performance
•
Uncertain future cash flows
•
Risk reduction for firm
•
Tangible resources
•
Intangible resources
2.2.3. Value Reducing Diversification
•
Diversifying managerial employment risk
•
Increasing managerial compensation
|
 Related
Constrained
diversification
Both operational
Corporate
relatedness
Unrelated
diversification
Related linked
diversification
Operational relatedness:
Sharing
Activities
Between
Business
High
Low
Low
High
Corporate relatedness:
transforming core competencies into business
Figure 2: Value Creating Diversification Strategies: Operational and Corporate
Relatedness
2.3. Operational and Corporate Relatedness
When
a
company
decided
to
do diversification,
it
was
important
to
pay
attention
in
relation between core-competencies and operational
of
the
company.
Operational
relatedness and corporate relatedness are the ways to diversify for creating value for the
company. Study about relation of these two things showed how important resources and
key-competencies are when company needed to diversify.
2.4. Levels of Diversification (Hill et al, 170: 2007)
•
Single Business: 95% or more of revenue comes from a single business.
•
Dominant
Business: between 70%
and
95%
of
revenue
comes
from
a
single
business
•
Moderate to High Level of Diversification
|
|
o
Related Constrained:
less than 70% of revenue comes
from the dominant
business, and all business share product, technological, and distribution
linkages.
o
Related linked (mixed related and unrelated):
less than 70% of revenue
comes from the dominant business and there are only limited links
between businesses.
•
Very High Levels of Diversification
o
Unrelated:
less than 70% of revenue comes
from the dominant business
and there are no common links between businesses.
2.5. Types of Diversification
•
Related Diversification
Diversification
into a
new
business activity
is
linked
to
a
company’s existing
business activity or activities, by commonality between one or more components
of each activity’s value chain. Normally, these linkages are based on
manufacturing,
marketing
or technological commonalities.
Example:
Philip
Morris did diversification
by acquiring Miller Brewing because there is closed
relation between beer and smokers.
•
Unrelated Diversification
Diversification into a new business area has no obvious connecting with any of
the company’s existing areas.
|
 2.6. Diversification for Grand Strategy
As
explained
before,
diversification
may
become
a
variant
of corporate-strategy.
Diversification together with other variant of strategies
might be
used by a company to
reach
its goals.
There are two
matrixes
which connected with diversification. First, was
Grand Strategy Selection Matrix and second was Model of Grand Strategy Clusters. In
Grand Strategy Matrix we can see that diversification would be chosen by the company
with strong external pressure/inducements. In Strategy Cluster Matrix, diversification
would be used in slow market-growth. The target of this strategy was to create new-value
for the company outside the existing market at this moment.
Overcome Weakness
Internal
(redirected
resources
Turnaround or
retrenchment Divesture
Liquidation
I
II
IV
Vertical Integration
Conglomerate
diversification
External
(acquisition
or
merger
for
within the firm)
Concentrated growth
Market development
Product development
Innovation
III
Horizontal Integration
Concentric diversification
Joint venture
resource
capability)
Maximize Strengths
Figure 3: Grand Strategy Selection Matrix (Pierce II & Robinson Jr, 208: 2003)
|
 Rapid Market Growth
Strong
Competitive
•
Concentrated Growth
•
Vertical Integration
•
Concentric
diversification
I
II
•
Reformulation
of
concentrated growth
•
Horizontal integration
•
Divestiture
•
Liquidation
Weak
Competitive
Forces
IV
•
Concentric
diversification
•
Conglomerate
diversification
•
Joint ventures
III
•
Turnaround
or
retrenchment
•
Concentric
diversification
•
Conglomerate
diversification
•
Divestiture
•
Liquidation
Forces
Slow Market Growth
Figure 4: Model of Grand Strategy Clusters (Pearce II & Robinson Jr, 210: 2003)
2.7. Growth Strategy: Diversification
Definition
A strategy based on investing in companies and sectors which are growing faster than
their peers.
WIKA has already decided to grow as named the roadmap to 2010. In the end of the
roadmap, the company hopes to be the excellent company in Southeast Asia with Sales
Growth of 36%. Core business
is still
in construction but
it
focuses
in EPC, Investment
and
International
Construction.
From 2002
to
2010
WIKA
has
gradually
changed
its
business-lines but never leave the construction as a core business.
|
     Existing Products
New Products
Existing
Markets
Market
Penetration
Product Development
New
Markets
Market
Diversification
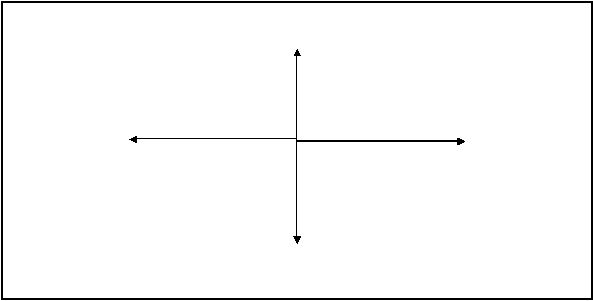
2.7.1. Ansoff Matrix
Igor Ansoff presented a matrix that focused on the firm's present and potential products
and markets (customers). By considering ways to grow via existing products and new
products,
and
in
existing
markets
and
new
markets,
there
are
four
possible
product-
market combinations. Ansoff's matrix is shown below:
Development
Figure 5: Anzoff Matrix
2.7.2. What is the product – Market-Grid - Description
The Product/ Market Grid of Ansoff is a model that has proven to be very useful in
business unit strategy processes to determine business growth opportunities.The Product/
Market Grid has two dimensions: products and
markets.Over
these
2
dimensions,
four
growth strategies can be formed.
Four growth strategies in the product/market grid:
1. Market Penetration. Sell more of the same products or service in current
markets.
These
strategies
normally try to change
incidental
clients
to
regular
clients, and
regular client
into
heavy clients.
Typical
systems are
volume
|
|
discounts, bonus cards and Customer Relationship Management. Strategy is often
to achieve economies of scale through more efficient manufacturing, more
efficient distribution, more purchasing power, overhead sharing.
2. Market Development. Sell more of the same products or services in new
markets.
These
strategies
often
try to
lure
clients
away
from competitors
or
introduce existing products in foreign markets or introduce new brand names in a
market. New
markets can be geographic of functional, such as
when we sell the
same product for another purpose. Small modifications may be necessary. Beware
of cultural differences.
3. Product Development. Sell new products or services
in current markets.
These
strategies
often
try
to
sell
other
products to (regular) clients. These can be
accessories, add-ons, or completely new products. Cross-selling. Often, existing
communication channels are used.
4. Diversification. Sell new products or service in new markets. These strategies are
the
most
risky
type
of strategies.
Often
there
is
a
credibility
focus
in
the
communication to explain why the company
enters
new
markets with new
products. On the other hand diversification strategies also can decrease risk,
because a
large corporation can spread certain risks if
it operates on
more than
one market.
Diversification can be done in four ways:
-
Horizontal
diversification.
This
occurs
when
the
company
acquires
or
develops
new products
that could appeal to
its current customer
groups
|
|
even though those new products
may be technologically
unrelated
to the
existing product lines.(new products, current market)
-
Vertical diversification. The company moves into the business of its
suppliers or into the business of its customers. (move into firms supplier's
or customer's business)
-
Concentric
diversification. This results
in
new product lines or services
that have technological and/or marketing synergies with existing product
lines, even though the products may appeal to a new customer group. (new
product closely related to current product in new market)
-
Conglomerate diversification. This occurs
when there
is neither
technological nor marketing synergy and this requires reaching new
customer groups. Sometimes used by large companies seeking ways to
balance a cyclical portfolio with a non-cyclical one.(new product in new
market)
There are two types of diversification:
-
related
-
unrelated diversification.
Related diversification means that the firm remains in a particular industry, but diversify into another type of
product
to be sold
to
new markets.
Unrelated diversification refers to a situation where the firm completely ventures into a new business area to
serve
new markets with
its
new product development.
New capital
investments
are also needed.
In this
scenario, it would mean that the firm is entering into an industry that it has little experience with limited or no
knowledge of the industry.
|
|
2.7.3. Selecting a Product-Market Growth Strategy
The market penetration strategy is the least risky since it leverages many of the firm's
existing resources and capabilities. In a growing market, simply maintaining market share
will
result
in
growth,
and
there
may
exist opportunities
to
increase market
share
if
competitors reach capacity limits. However, market penetration has limits, and once the
market approaches saturation another strategy must be pursued if the firm is to continue
to grow.
Market
development
options
include
the
pursuit
of additional
market
segments
or
geographical regions. The development of new
markets
for the product may be a
good
strategy if the firm's core competencies are related more to the specific product than to its
experience
with a
specific
market segment.
Because
the
firm is
expanding
into a
new
market, a market development strategy typically has more risk than a market penetration
strategy.
A
product development strategy may be appropriate if the firm's strengths are related to
its
specific
customers
rather than to
the specific
product
itself.
In this
situation, it
can
leverage its strengths by developing a new product targeted to its existing customers.
Similar to the case of new market development, new product development carries more
risk than simply attempting to increase market share.
Diversification is
the
most
risky
of
the
four
growth
strategies
since
it
requires
both
product and market development and may be outside the core competencies of the firm.
In
fact, this quadrant of
the
matrix
has been referred
to by some as
the
"suicide cell".
|
|
However, diversification may be a reasonable choice if the high risk is compensated by
the
chance
of
a
high
rate
of return.
Other
advantages
of diversification
include
the
potential to gain a foothold in an attractive industry and the reduction of overall business
portfolio risk.
The
product/market
grid
of
Ansoff
is
a
model
that
has
proven
to
be
very
useful
in
business unit strategy processes to determine
business
growth
opportunities.
The
product/market grid has two dimensions: products and markets.
2.8. What kind of decision will be the best in diversification?
What is the basis?
2.8.1. Diversity to unrelated industry
Example: Conglomerate PT Astra International Tbk.
In 1957, Astra was established as a trading company. Over the course of its development,
Astra has formed a number of strategic alliances with leading global players in various
industries.
Since 1990, the Company had been a go public company, listed on both the Jakarta and
Surabaya Stock Exchanges, now known as the Indonesia Stock Exchange with the
Company’s
market capitalization
as
of
31
December 2007 stood
at
Rp
110.5
trillion.
Astra now has six
core businesses: Automotive, Financial Services, Heavy Equipment,
Agribusiness, Information Technology and Infrastructure. At year-end 2007, Astra Group
had a workforce of 116,867 people, spread across 130 subsidiaries and affiliates.
|
    Table 1: Financial Performance
(Rpbn)
Net revenue
Operating profit
2006
2007
Growth (%)
2006
2007
Growth (%)
Automotive Financial
services Agribusiness
Information technology
Heavy equipment and mining
Others
Total
Less elimination
Total consolidated
Contribution (%)
30,259.0
38,318.4
26.6
7,567.8
7,310.5
(3.4)
3,758.0
5,961.0
58.6
619.0
725.6
17.2
13,719.6
18,165.6
32.4
28.9
28.3
(2.0)
55,952.2
70,509.3
26.0
(243.0)
(326.4)
34.3
55,709.2
70,183.0
26.0
859.1
1,717.9
99.9
727.0
1,355.6
86.5
1,198.6
2,907.1
142.5
76.7
95.1
23.9
1,340.1
2,393.3
78.6
(10.4)
(8.9)
(14.4)
4,191.2
8,460.0
101.9
52.0
41.5
(20.3)
4,243.2
8,501.5
100.4
Automotive Financial
services Agribusiness
Information technology
Heavy equipment and mining
Others
54.1
54.3
13.5
10.4
6.7
8.5
1.1
1.0
24.5
25.8
0.1
0.0
20.5
20.3
17.3
16.0
28.6
34.4
1.8
1.1
32.0
28.3
(0.2)
(0.1)
Total
100.0
100.0
100.0
100.0
Source: Bahana Securities
2.8.2. Diversity to related-industry
|
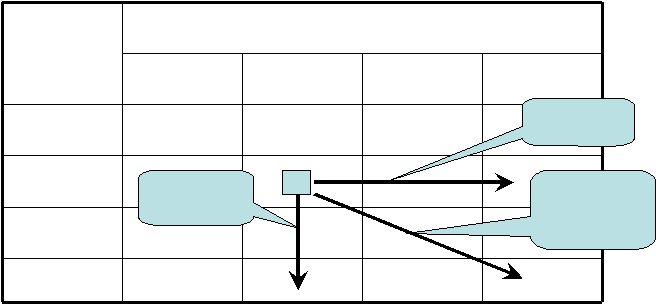
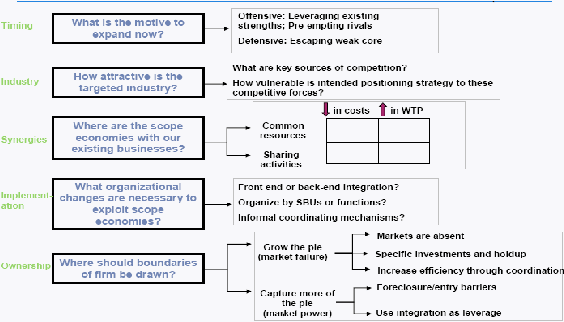 Figure 6: Strategies of Related Diversification
Timing: The first question to assess is the competitive strength of the firm that is looking
to expand. Is the motive to expand an offensive one-- triggered by healthy margins in the
core business, and strengths that can be leveraged elsewhere? Or, is it primarily
defensive,
where a
firm is
looking
to
“escape”
its declining
core?
Unfortunately, scope
expansions are in most cases not effective in solving the latter predicament; in addition,
they are
unlikely to
leverage
any existing strengths of the firm in
such a setting. Thus,
Bausch and Lomb, the market leader in soft contact lenses, decided to expand away from
its core business when growth slowed and competitors attacked with new technologies
such as cast
molding. The company
invested
in electric toothbrushes, dental aids, skin
ointments, and hearing aids. After several years, and having seen its market share in its
core business decline from 40% to 16% (while Johnson and Johnson introduced the idea
of
disposable
lenses),
Bausch and
Lomb exited
many
of
these
noncore
businesses
and
looked to focus on the core again. Companies in similar situations often do well not by
|
|
looking outward but
inward:
invariably, a more effective solution is to
identify ways to
solve the problems in, and “profit from the core”1, as companies like Harley-Davidson
have done.
Industry
attractiveness:
Structurally, how attractive is the new business arena being
considered
for
expansion? Do
incumbents
enjoy
healthy
margins
or
are
competition
likely to be fierce and profits meager? The familiar “five forces” analysis is useful not
only in predicting industry profitability but, more importantly, in identifying the various
sources of competition that
the
company
is
likely
to
face. Specifically,
it
is
useful
to
examine
whether and
how the
firm’s
intended entry strategy can effectively combat the
likely competitive forces. For example, consider the furniture industry. An entrant that
seeks to exploit scale economies by automating manufacturing processes
is likely to be
more vulnerable to the industry’s cyclical dynamics since automation would increase the
fraction of its costs that are fixed. On the other hand, the “infinite variety” in designs that
characterizes the industry also makes it difficult for manufacturers to develop brands with
consistent identities and carve out a high-end position.
Scope
economies
with
existing
business:
The
viability
of an
entry strategy
leaves
unanswered the question of which firm is in the best position to pull off such a strategy.
Specifically, what are the scope economies or
synergies
with
the firm’s
existing
businesses: might expansion into the new businesses either leverage particular strengths
from the existing ones, or benefit them in turn? Exhibit 1 illustrates the different sources
of such synergies. These might arise from cost-sharing: for example, the centralization of
procurement, combination of staff functions, economies
in distribution and logistics, or
common production platforms. Or, they might enhance revenues of the combined
|
|
businesses by mechanisms such as cross-selling, bundling, and one-stop shopping. While
cost synergies are often the driving force in scope expansions and mergers, the search for
revenue synergies has become more common as well. For example, several mergers
between high-end and low-end machine tool manufacturers in the last decade were driven
by the desire to combine breadth of product offerings in “one-stop shopping” for
industrial customers. Health care delivery has seen the emergence of multi-business firms
like
Covenant
Health
Systems,
whose outpatient
ambulatory
care
centers
have
led
to
more
referrals
for
more
profitable
inpatient
care.
And,
cross-selling
motivations have
resulted in financial services companies like Charles Schwab expanding to offer products
ranging from money market funds to investment advisory services.
Each of the synergies described above stems
from the sharing of activities by different
businesses. Activity
analysis is
a
useful,
and
concrete,
approach
to
evaluating
scope
economies. At the same
time, it
is useful to keep in mind that tangible activity
coordination
is
not
the
only
source
of
synergies.
Often,
synergies
can arise
from the
sharing of resources or intangible skills.
These
might include a common brand,
reputation, specific knowledge and expertise, managerial talent, systems and processes,
values, or even a common culture.
As these examples illustrate, resource sharing, while intangible, can be no less important.
More
importantly,
it suggests a different
way to evaluate the question of
“relatedness”
between any two businesses: rather than simply ask whether the products being sold by
the
businesses
are
related,
one
ought
to also
examine
whether
there
are
common
competencies
required to
succeed
in
these
businesses.
This
can often
lead
to
counterintuitive,
but
no
less
powerful, expansion
decisions. For
example,
Honda
|
|
expanded into cars, motorcycles, lawn mowers, and generators, leveraging its
competence in engines and power trains. Canon expanded into copiers, laser printers, and
cameras, exploiting its competencies in optics, imaging, and processor controls. And,
Minebea expanded from ball bearings to semiconductors, leveraging its competence in
miniaturized manufacturing.
Each of these examples suggests a useful principle
to
keep
in
mind when
evaluating
resource sharing benefits: these benefits are
most compelling when the competencies
in
question are not only
(i) important drivers of performance in that business, but they are also (ii) distinctive or
unique to the firm.
Organizational
mechanisms
for
coordination:
Having examined the potential sources
of synergies, one ought to scrutinize how exactly they will be realized. Specifically, what
organizational mechanisms need to be put in place to ensure this? Firms often deem this
question to fall under the domain of “implementation”. However, failing to think through
the organizational choices and changes that accompany any scope expansion is a
common reason why
mergers
fail.
Consider,
for example,
Saatchi and Saatchi’s
foray
into the consulting businesses in the 1980s. Regardless of whether one viewed the
potential synergies between advertising and consulting services to be large or small, the
firm’s approach to organizational integration proved to be the decisive factor in its failed
expansion. Specifically, its approach of “front-end separation, back-end integration”—
while successful in integrating its earlier advertising acquisitions—was flawed here, in
light of the differences between the “push based” budgeting systems
common in
consulting and the “pull based” approach intrinsic to advertising.
|
|
The
nature
of
organizational coordination
will
of
course
be
informed
by
the
types
of
synergies identified above. For example, the incentives to cross-sell two products will be
greater when there is a common sales-force for both products than with different ones for
each. Or, the ability to leverage company-wide competencies is often easier with a
functional organizational structure than with a divisional one. And, in addition to the role
of the formal organizational structure in facilitating (or impeding) coordination, informal
mechanisms can often be quite powerful in “boundary-spanning” as well: company-wide
norms, values, and cultures. Recognizing, and acting on, these organizational changes can
be critical to realizing the benefits of scope in practice.
Ownership:
Extracting
the rents from expansion
into a new arena does not require that
companies fully own the new business as well. The choice of ownership (i.e., where the
boundaries
of
the
firm
should
be drawn) is relevant for
most
horizontal
expansion
decisions, but is particularly central to firms’ decisions on whether to expand into
adjacent parts of the value chain—the vertical integration question. Therefore, although
the key insights behind the logic of ownership are quite general, they are discussed, in
what follows, largely in the context of the choice to vertically integrate.
Source: Adopted from Bharat N. Anand, Strategies of Related Diversification (2005)
Example: Engineering and Construction: PT Wijaya Karya (Persero) Tbk.
Table 2: Growth of order
|
 Source: company
Table 3: Financial Performance
Year to 31 Dec
2006
2007
2008F
Revenue (IDRb)
EBITDA (IDRb)
Net Profit (IDRb)
EPS (IDR)
Growth (%)
P/E (x)
BVPS (IDR)
P/BV (x)221
EV/EBITDA (x)
ROA (%)
ROE (%)
Dividend (IDR)
Dividend Yield (%)
3.049
135
94
16
37.3
36.7
69
8.6
25.6
3.5
23.3
13
2.2
4.285
242
129
22
37.5
14.5
221
1.4
3.4
3.1
10.0
4.8
1.5
6.450
281
152
26
17.8
12.3
240
1.3
4.7
2.7
10.8
6.6
2.1
Source: company, Bahana Estimates
Table 4: Construction Company Margin
|
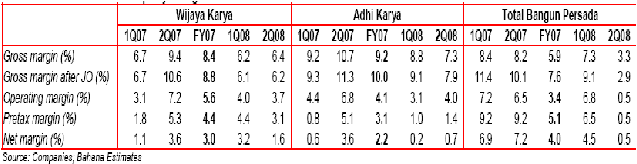 WIKA : fully diversified; ADHI : partly diversified; TOTL : focus
TOTL net margin was higher than the others when the construction growth was high in
2007. On the other hand when oil prices
increased significantly since the beginning of
2008, the cost of construction company raised and could possibly ruin its profit as shown
at above figure. As escalation clause on cost of construction only applicable for
multi
year projects and mostly for companies with exposures to government projects, the
benefited companies would be WIKA and ADHI.
WIKA would be the most benefited because of it diversified business model to reduce the
volatility
in margin
as
a
result of the
uncertain raw
material
cost and
global
finance-
turmoil.
2.8.3. Do not diversify
From the figure below, there are many other industries which have interesting growth in
its
own
business.
It
means
even focusing
in
one
line
of
business;
it
will
still
have
opportunity to grow in its industries.
|
 Table 5: The growth of industry in Indonesia
Mkt Cap
US$mn
EPS Growth (%)
05A
06A
07A
08F
ROE (%)
05A
06A
07A
08F
Indonesia
Banking
Mining & Energy
Telecom
Consumer & Retail
Automotive
Cement**
Plantations
Heavy Equipments
Property
Oil & Gas services
Construction
Toll Road
Poultry
115,367
30,836
29,616
19,487
9,892
7,931
5,296
3,944
3,545
2,358
651
270
280
79
2.7
43.1
50.9
27.1
-19.5
68.4
23.0
21.9
16.2
52.0
107.6
33.8
15.9
26.5
26.1
19.0
-10.4
96.4
10.3
8.3
0.9
-32.0
58.7
27.7
44.7
-16.4
45.3
47.0
-6.1
36.8
112.2
55.3
-4.4
-10.9
59.5
31.8
-0.1
-8.1
3.6
11.0
N/A
N/A
3.1
57.6
7.1
35.6
19.8
55.4
22.8
50.3
-29.5
59.0
N/A
480.5
-14.7
-18.2
20.6
22.5
27.2
26.3
18.7
18.3
18.7
19.5
23.8
30.7
45.3
40.1
27.4
32.0
31.9
30.6
4.4
6.2
6.0
6.4
26.7
16.6
22.2
23.7
13.0
15.3
18.5
20.7
25.6
23.7
35.9
39.7
25.6
20.4
26.0
27.7
10.3
8.5
6.4
6.7
N/A
15.5
14.4
20.2
20.7
22.6
12.8
16.9
13.2
16.8
5.8
8.1
11.0
39.9
26.7
18.0
Source: Bahana Securities
|