|
6
CHAPTER 2
THEORETICAL FOUNDATION
In this chapter, the author will
explain the details
of
relevant
theory or theoretical
foundation, which will be used to support the design of the new system.
2.1 System
According
to
Satzinger,
Jackson
and
Burd¹,
system
is
a
collection of interrelated
components that function together to achieve some outcome. There are three major
components of system, namely input, processing, and output.
According to encarta.com²
,
system
is a collection of component elements that work
together to perform a task.
2.2 Information System
According
to
Satzinger,
Jackson
and
Burd³,
Information
System
is a
collection
of
interrelated components that collect, process, store, and provide as output the
information needed to complete business tasks.
1
Satzinger,
Jakson, Burd (2004). Systems Analysis and Design in a Changing World. 3rd ed.Boston:
Thomson Course Technology. P6.
2
Encarta.
(2007). System.
Available: http://encarta.msn.com/encyclopedia_761560074/System. Last
accessed 14 September 2007.
3
Satzinger, Jakson, Burd (2004). Systems Analysis and Design in a Changing World. 3rd ed.Boston:
Thomson Course Technology. P6.
|
 7
According
to Turban,
Rainer, and Potter
4
,
information
system
is a
process which
collects, process es, analyzes,
and disseminates information for a specific purpose.
Information
system
includes
input,
process (data, instruction) and output (reports,
calculatio n).
2.3 Methodologies
2.3.1 SDLC
According to Satzinger, Jackson, Burd
5
, SDLC (System development Life
Cycle)
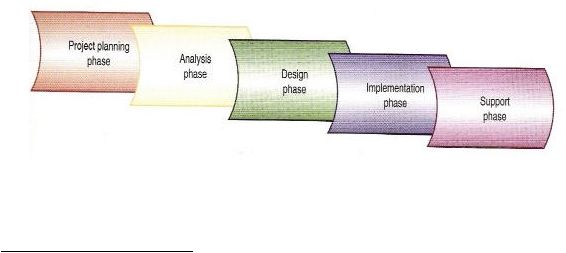
is a concept to plan and manage the systems development process. The
SDLC describes phase and activities required for all system developme nt. The
SDLC process consists of five phases, namely project planning phase, analysis
phase, design phase, implementation phase, and support phase.
Figure 2.1 Information system
development
phases
(Satzinger, pg.37)
4
Turban, Rainer, Potter (2003).
Introduction
To Information Technology. 2nd ed. New Jersey: John Wiley
&
Sons. P15.
5
Satzinger,
Jakson, Burd (2004). Systems Analysis and Design i n a Changing World. 3rd ed.Boston:
Thomson Course Technology. P36.
|
|
8
2.3.1.1 Project Planning Phase
The
first phase of SDLC is Project planning. This phase is the initial
phase of
SDLC,
which objective
is
to
identify
the
scope
of
the
new
system, ensure that the project is feasible, and develop a schedule,
resource plan, and budget
for the remainder of
the project.
During
the
project planning phase, five activities are identified:
Define the problem
This is the most important activity of the planning phase because at
this stage, we will know all of the functions or processes that will be
included within the system.
It
is
also
important
to
identify
the
major
usage
of
the
new
system
and
the business
problems
that
the
new system must address.
Produce the project schedule
A
detailed project schedule listing tasks, activities and required staff
is developed. Sometimes a large project needs to elaborate schedule
with specific, identifiable milestone, and control procedures.
Confirm project feasibility
This phase is
focused
on
investigating economic,
organizational,
technical, resource, and schedule feasibility.
Staff the project
Staffing the project is an activity that is closely related to producing
the project schedule because when the project is large, it is required
|
|
9
to identify the necessary human resources and plan to acquire them
at the required times during the project.
Launch the project
At this stage, the total plan is reviewed with upper management and
the project is initiated. An official announcement often
communicates the project launch.
2.3.1.2 Analysis Phase
The second phase of SDLC is analysis phase.
The
main objectives of
the
analysis phase
are to
understand
and
document
the business needs
and the processing requirements of the new system. During the analysis
phase, six primary activities are being considered:
Gather information
At
this
stage,
gathering
information
is
a
fundamental part of
the
analysis because during this activity, system analyst will meet with
the
users
to
learn
as
much
as
possible about the problem domain
(the area of the user’s business for the system to be developed).
Gather system requirements
The scope of an analyst is not only limited to information gathering,
but also reviewing, analyzing, and structur ing the
information
obtained so that they can develop an overall understanding of the
new system requirements.
|
|
10
Build prototypes for discovery of requirements
This
is
the
most
important activity
that can help analyst
to
gather
and
understand
the
requirements
to
build
a
prototype
of
pieces
of
the new system, so that the users can do a review.
Prioritize requirements
As
the
processing requirements are uncovered, each must be
prioritized.
Generate and evaluate alternatives
At this stage, analysts should prioritize the requirements and they
also ought to research various alternatives for implementing the
system.
Implementation
alternatives
include
installing the
system,
and buying the software package, etc.
Review recommendations with management
At the last stage, the team selects and recommends an alternative to
upper management.
2.3.1.3 Design Phase
The third phase of SDLC is design phase.
This phase has a purpose to
design the solution system based on the requirements defined and
decisions made during analysis. During this phase, there are seven
major activities that must be done:
Design and integrate the network
In this globalization era,
many
new
systems
are being
installed
in
network
and
client-server environment. Occasionally, the
design
|
|
11
has
already been
completed
based
on
the
existing
operating
environment and strategic IT plans.
Design the application architecture
The application
is
a
part
of
the
new
information
system
which
satisfies user’s needs regarding the problem domain.
Design the user interface
The user interface is a critical component of any new system.
During
design
process,
there are
elements
combined
in order
to
yield an integrated user interface.
Design the system interface
Most of the new
information systems must also
be
interconnected
with other existing
systems, so the design of
the method details of
communication link are clearly defined.
Design and integrate the database
Database and information files are an integral part of information
system. The database for the specific system must also be integrated
with
information databases of
other
systems that
are already being
used.
Prototype for design details
Build prototype in parts of the system is crucial to ensure
that the
function will run successfully in the operating environment.
|
|
12
Design and integrate the systems control
Every
system
must
have
sufficient
controls
to
protect
the
integrity
of the database and the application program. This control should be
integrated into the new system while it
is being designed and it can
not be run after it has been constructed.
2.3.1.4 Implementation Phase
The fourth phase of SDLC
is implementation phase. In this phase, the
final
process
is
to
build,
test, and
install
a
reliable
information
system
with trained users being ready to gain benefit as has been expected from
the
use of the system. During implementation pha se,
there
are
five
activities:
Construct software components
The software can be constructed through various techniques. One of
them that generally being
use is the
conventional approach
(using
Visual Basic or Java).
Verify and test
The
software
that
has
been
constructed
should be
tested
to
verify
that the system actually
works.
The
additional testing
that
is
intended to ensure that the system will meet the system’s user needs
might be conducted as necessary.
|
|
13
Convert data
At this stage, the existing information is important and needs to be
converted to the format required in the new system.
Train users and document the system
A critical activity during implementation is to train users on the new
system, so that they will be productive as soon as possible.
Install the system
At this stage, the new equipment must be in place and functioning,
the
new computer
programs
must
be
installed
and
working
well,
and the database must be populated and available.
2.3.1.5 Support Phase
The last part of SDLC phase is support phase. This phase has a purpose
to keep the system
running productively
initially and during the
many
years of the system’s lifetime.
During the support phase, there are three major activities that occur:
Maintain the system
The complexity of software and the impossibility of testing every
possib le combination of processing requirements can create
conditions that the system are not fully tested and thus are subject to
errors.
|
|
14
Enhance the system
In
order
to implement the major enhancement, the company must
approve and
initiate
an
upgrade
development project.
An
upgrade
on the project often results in a new version of the system.
Support the users
Most
activities
require
supporting
phase,
for
example
to provide
assistance to the system. One of the activities is called help desk. A
help desk cons ists
of knowledgeable
technicians,
activities of
training new users and maintaining current document.
2.3.2 Prototyping
According to
Turban, Rainer, and Potter
6
, prototyping is an alternative
development
approach
in which
system
developers
first
obtain
only a general
idea
of
user
requirements,
develop
prototype
that
is quickly
put into
use,
and
then refine the prototype based on user’s suggestions and experiences with it.
The main reason
for using prototypes
is to test the
feasibility and to identify
processing requirements.
6
Turban, Rainer, Potter (2003).
Introduction
To Information Technology. 2nd ed. New Jersey: John Wiley
&
Sons. Glossary G-17.
|
|
15
According to google.com
7
, prototyping is a system
development method
(SDM)
in
which
a
prototype
(an early approximation of a final system or
product) is built, tested, and then reworked as necessary until an acceptable
prototype
is
finally achieved
from
which
the
complete
system or product
can
now be developed.
2.3.2.1 Types of Prototypes
According to Satzinger, Jackson, Burd
8
, there are
two
types of
prototype that are commonly used in software development:
Discovery Prototype: A prototype that is often used during
analysis and occasionally during design.
Developmental
prototype:
A
prototype
system
that
is
not
intended
to
be
thrown away and become
all part
of
the
final
system (primarily used in iterative software development).
7
Google. (2007). Definition prototyping. Available:
Last accessed 14 September
2007.
8
Satzinger,
Jakson, Burd (2004). Systems Analysis and Design in a Changing World. 3rd ed.Boston:
Thomson Course Technology.
p677.
|
 16
2.3.2.2 Advantages of SDLC and Prototyping
9
Advantages of SDLC
Advantages of Prototyping
Good control
Focus on tradeoffs
Create detailed documentation
which is valuable for
maintenance
Focus on goals
End user is involved
Reduce time and costs
Receive direct feedback while developing
Higher satisfaction for the end user
Expose developers to potential future
system enhancements
Table 2.1
Advantages of SDLC and Prototyping
9
Google. (2008). Advantages SDLC and Prototyping. Available:
Last accessed 20 January 2008 .
|
 17
2.3.2.3 Disadvantages of SDLC and Prototyping
10
Disadvantages of SDLC
Disadvantages of Prototyping
Requires more time and money
Estimation of time and cost is
difficult
System developing is an art not a
science
Users are not involved
Inflexible
Poor models for complex projects
High Risk
No working software is produced
until late during the life cycle.
Analysts are not involved
Developers
can
become
too
attached to their prototypes
Can cause systems to be left
unfinished
Sometimes leads to incomplete
documentation
Table 2.2 Disadvantages
of SDLC
and Prototyping
2.3.3 Rapid Application Development
According to James Martin
11
, Rapid
Application
Development
(RAD)
is a
development
lifecycle designed
to
give
much
faster development and higher-
quality results than those achieved with the traditional lifecycle. It is designed
10
Google. (2008).
Disadvantages SDLC and Prototyping. Available:
Last accessed 20 January 2008 .
11
James Martin. (2000).Rapid application Development. Available:
http://www.casemaker.com/download/products/totem/rad_wp.pdf. Last accessed 7 April 2007.
|
|
18
to take
the
maximum advantage
of
powerful development
software that
has
evolved recently.
By
using
RAD
in the system, we can combine
it with JAD (Joint Application
Design), prototyping,
and
integrated
CASE
tools
which
will produce
a
high
quality system. It is such systems in which requirement, design and the system
itself are developed
with
sequential
refinement.
RAD
(Rapid
Application
System) methods also enable the user to build application software.
2.3.3.1 Advantages of Rapid Application Development (RAD)
12
1. Active user involvement in analyzing and designing stages
2. Easier implementation due to user involvement
3. Flexible and adaptable to changes
4. Increase the speed of system development
2.3.3.2 Disadvantages of Rapid Application Development (RAD)
1.
Reduce
scalability.
This
happens
because
an
RAD developed
application
starts
as
a
prototype
and
it evolves
into
a
finished
applicatio n.
2.
Reduce
feature.
This happens because the design
features may be
restricted by the scope of the prototyping tool.
12
Google. (2008). Advantages and disadvantages of RAD Available:
. Available:
http://www.selectbs.com/glossary/what -is -rapid -application-development.htm.
Last accessed 20 January 2008.
|
|
19
2.4 Technique s
2.4.1 Structures analysis technique
According to Satzinger, Jackson, Burd¹3, structured analysis is a technique that
helps the
developer
defines
what
the
system
needs
to
do
(the
processing
requirements), what
data
the
system
needs
to store and use in terms of data
requirements, what inputs and outputs are needed, and how the functions work
together as a whole to accomplish tasks.
2.4.2 User interviewing technique
According to Satzinger, Jackson,
Burd¹
4
,
user interviewing
is a technique that
helps project team in getting more information about the current system
process and user’s expectation of the proposed system. It will he lp develop the
project more efficiently.
13
Satzinger, Jakson, Burd (2004). Systems Analysis and Design in a Changing World. 3rd ed.Boston:
Thomson Course Technology. P52.
14
Satzinger, Jakson, Burd (2004). Systems Analysis and Design in a Changing World. 3rd ed.Boston:
Thomson Course Technology. P47.
|
 20
2.5 Entity Relationship Diagram
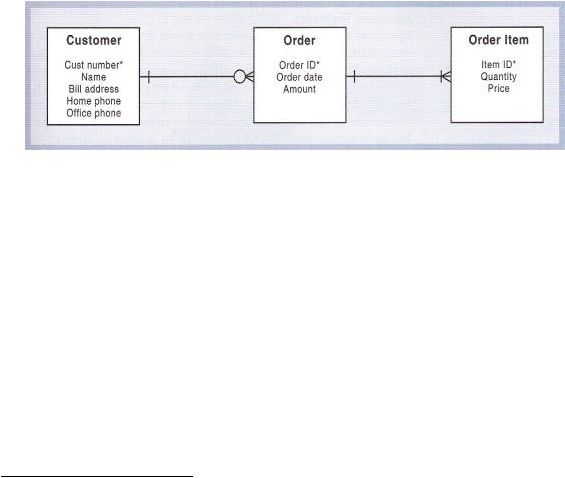
According to Satzinger, Jackson, Burd 1
5
, an entity relationship diagram is a
graphical model of the data needed by a system, including things about which
information
is
stored
and the
relationships
among
them,
produced
in
structured
analysis and information engineering. The data entities from the entity-relationship
diagram correspond to the data storage shown on data flow diagrams. For example,
to
process
a
new
order,
the
system
needs to
know about
the customer, the
items
wanted, and the details about the order.
Figure 2.2 Entity-relationship
diagram (ERD) created using the structured
analysis technique.
(Satzinger
pg.53)
15
Satzinger, Jakson, Burd (2004). Systems Analysis and Design in a Changing World. 3rd ed.Boston:
Thomson Course Technology. p 53.
|
|
21
2.5.1 Concepts of Entity Relationship Model
2.5.1.1 Entity
According
to
Peter
Rob,
Carlos
Coronel¹
6
,
an
entity
is
a
person,
place,
thing,
or
event
such
as customer,
employee
or product
about
which
information
is
maintained.
Typically, entities
can
be
identified
in
the
user’s
working
environment.
2.5.1.2 Attribute
According
to
Peter
Rob,
Carlos
Coronel¹
7
,
attribute
is
a
characteristic of an
entity or object, and it has a name and data type. In Chen model,
attributes are represented by ovals and are connected to the entity
rectangle
with
a
line.
Each
oval
contains
the
name
of the attribute it
represents. In the Crow’s Foot
model, the attributes are simply written
in
the attribute box below the entity rectangle.
18
There are four types of attributes:
•
Simple
Cannot be subdivided e.g. sex, marital status.
16
Peter Rob, Carlos Coronel (2004).
Database Systems: Design, Implementation & Management. 6th ed.
Boston: Thomson Course Technology. P124.
17
Peter Rob, Carlos Coronel (2004).
Database Systems: Design, Implementation & Management. 6th ed.
Boston: Thomson Course Technology. P124.
18
Peter Rob, Carlos Coronel (2004). Database Systems: Design, Implementation & Management. 6th ed.
Boston: Thomson Course Technology. P127
|
|
22
•
Composite
Can be subdivided into simple attributes e.g. address into street, city, and
postcode.
•
Single-valued
Can have only a single value e.g. a person has one social security number.
•
Multi- valued
Can have many
values e.g. a person may have several contact numbers.
2.5.1.3 Relationship
According to Pete®
Rob,
Carlos
Coronel¹
9
,
relationship
is an association
between entities defined by diamond-shaped
symbol
in
an
Entity
Relationship Diagram.
Basically, relationship can be operating in both
directions. Relationship can be classified into three types:
• 1:1 (one to one) relationship
• 1:M (one to many) relationship
• M:N (many to many) relationship
Entities that participate
in a relationship are called participants.
There
are two relationship participants:
• Optional
One entity occurrence does not require a corresponding entity
occurrence in a particular relationship
19
Peter Rob, Carlos Coronel (2004). Database Systems: Design, Implementation & Management. 6th ed.
Boston: Thomson Course Technology. P130.
135
|
 23
•
Mandatory
One entity occurrence requires a corresponding ent ity occurrence in
a
particular relationship.
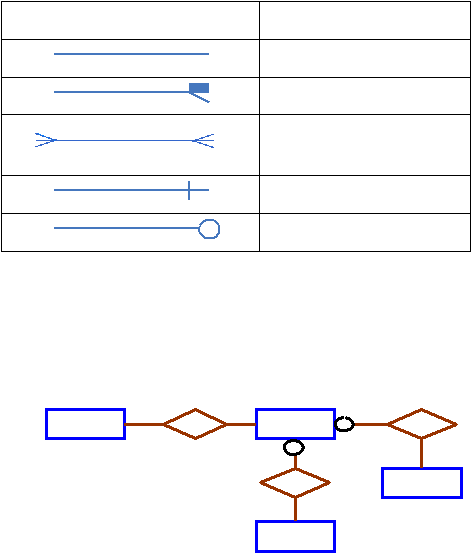
Symbo ls
Meanings
One-to-one relationship
One-to-many relationship
Many-to-Many relationship
Mandatory relationship
Optional relationship
Figure 2.3 Symbol
Entity Relationship
Diagram.
1
M
M
CUSTOMER
requests
CHARTER
flies
M
pilots
N
1
AIRCRAFT
PILOT
Figure 2.4
Entity Relationship
Diagram With
Entities,
Attribute and Relationship.
|
 24
2.6 Data Flow Diagram
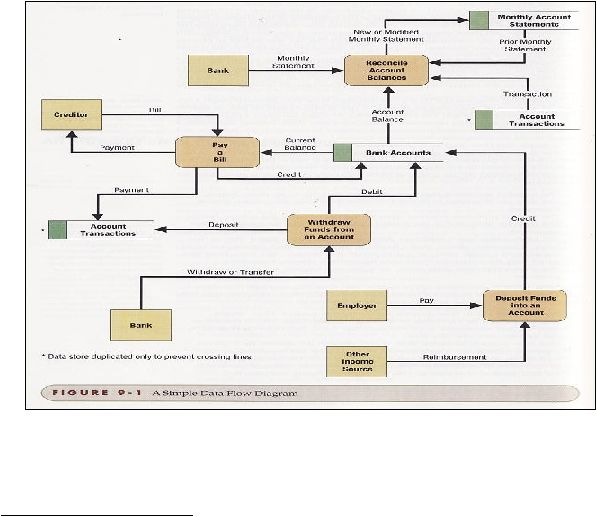
According to Bentley and Whitten
20
,
data
flow diagram is a process
model used to
depict the
flow of data through a system and the processing performed by
system.
This approach is to show the flow of data between and through process and
illustrates the places where data are stored.
Figure 2.5 Data Flow Diagram.
(Bentley & Whitten, 2007, pg.318)
20
Bentley, Whitten (2007). Systems Analysis and Design for the Global Enterprise. 7th ed. America,New
York : McGraw-Hill. P317
|
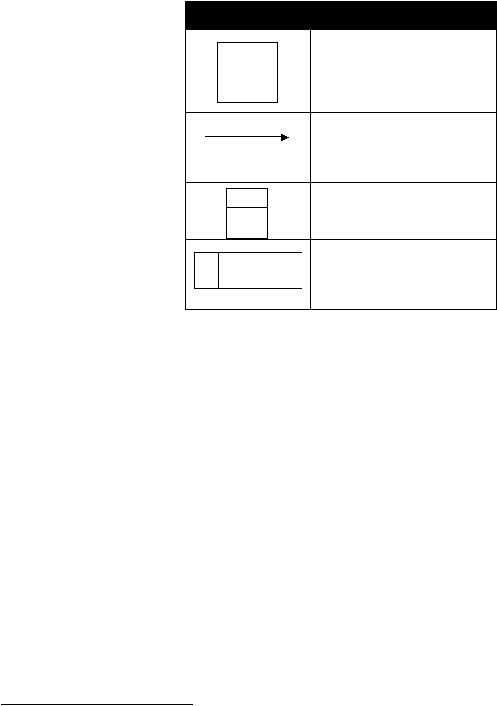 25
21Th
e
are four symbols that usually used in DFD:
Symbols
Meaning
External Agent
Data Flow
Process
Data Store
Figure 2.6 Symbol of
Data
Flow Diagram
Description:
1. External agent
An outside person, organization unit, system or organization that interact with
a
system.
2. Data flow
Data that are input or output to or from a process.
21
Bentley, Whitten (2007). Systems Analysis and Design for the Global Enterprise. 7th ed. America,New
York : McGraw-Hill.
P319,320,321,322,325
|
|
26
3. Process
A
work performed by a system in response to incoming data flows or condition.
4. Data store
Store data intended for later use.
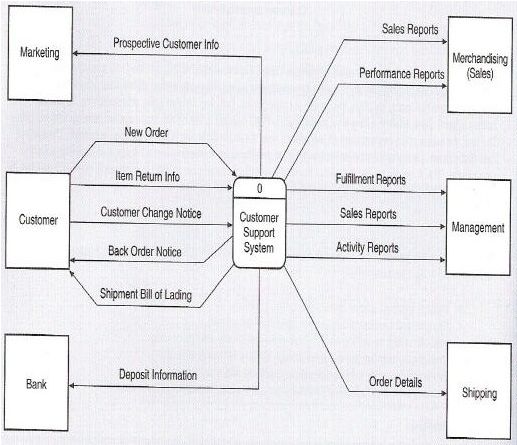
2.6.1 Context Diagram
According
to
Dennis,
Wixom,
Roth²²
,
context
diagram
is
the
first
DFD
in
every business process model whether manual system or computerized system.
The context diagram shows the overall business process as one process and
show the data flows to and from external entities. Basically, the context
diagram
contains
only
one
process.
Sometimes this process
is
identified by
the number “0”.
According to Satzinger, Jackson, Burd
23
, context diagram is a DFD that
describes the most abstract
view of a system. All external agents
and all data
flows
into
and
out
of
the
system
are
shown
in
one
diagram,
with
the
entire
system represented as one process. In context diagram, we can clearly see the
system boundary.
The system scope is defined by what is presented within the single process and
what is represented as external agents. External agents that that supply or
receive data from the system are not included in system scope, and everything
else is included the system scope.
22
Dennis, Wixom,
Roth. (2006). Systems Analysis and Design. 3rd ed. New Jersey: John Wiley & Sons.
P178.
23
Satzinger, Jakson, Burd (2004). Systems Analysis and Design in a Changing World. 3rd ed. Boston:
Thomson Course Technology. p 85, 204.
|
 27
Regularly, the context diagram does not show the data store because all of the
system’s data stores are considered to be within the system scope.
Figure 2.7 Context diagram for the customer support system (Satzinger,
pg.86).
|
 28
2.7 Local Area Network (LAN)
According to
Turban, Rainer and Potter²
4
,
Local Area Network(LAN) is a network
that connects two or more communicating devices within 2,000,000 feet (usually in
building), so that every user device on the network has the potential to communicate
with every other devices. A LAN allows a large number of users to share corporate
resources such as storage devices, printer, programs, data files and integrates a wide
range of
function
into a single
system. By
using
LAN, we can
acquire information
easier,
faster and more effective ly transfer
the
information
within
a
group of users
and reduce operational cost
2.8 C#.Net
According to Kyle lutes, Alka, Harriger, and Jack Purdum
25
,
C#
is
an
object-
oriented
programming
language
that
combines
the
high
productivity
of RAD
languages, such as Visual Basic
with the raw power of C#. C# is the programming
language
that is no t limited
to GUI
applications and
it is equipped with RAD
development
which
includes
user
interface design tools,
integrated
language help
system,
and
interactive
debugging.
The
disadvantage of C# is all the
developed
applications can only run on Windows operating system, not on Unix, or Macintosh.
24
Turban, Rainer, and Potter (2003 ).Introduction To Information Technology. 2nd ed. New Jersey: John
Wiley & Sons. P178.
25
Kyle lutes , Alka Harringer, and Jack Purdum (2006 ). An Information Systems Approach to Object-
Oriented Programming.
1st ed. Boston: Thomson Course Technology. P7, 8.
|
|
29
2.9 User Interface design
According
to Dennis, Wixom,
Roth²
6
,
a
user
interface design
is the way in
which
the users will interact with the system
and how the inputs and outputs of the system
will accept and produces with nature.
There are three fundamental user interface design:
1. Navigation mechanism
Navigation mechanism is the way in which the users gives instructions to the
system and tells what to do. For example: button and menu.
2. Input mechanism
Input mechanism is the way in which the system captures information. For example:
button and menu, forms for adding new customers
3. Output mechanism
Output
meschanism is the way in which the system provides information to the
user
or to the other systems. For example, report and web pages.
26
Dennis, Wixom, Roth (2006). Systems Analysis and Design. 3rd ed. New Jersey: John Wiley & Sons.
P306.
|
 30
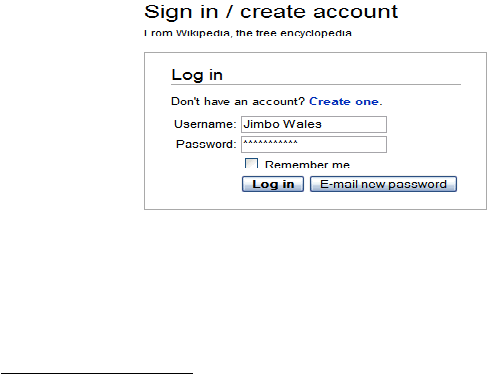
2.9.1 Login Feature
According to wikipedia.org
27
,
logging in and out is the process by which
individual access to a
computer system is controlled by identification of
the user in order to obtain credentials to permit access and it is an integral
part of computer security. A
user can
log
in to a system
to obtain access,
and
then
log out when the access
is no
longer needed. The objective of
computer login procedure is to authenticate the
identity of any computer
user attempting to access the computer's services and also can provide an
audit trail of the use of the system. Regularly, in order to log in, a system
requires a username and a password.
Figure 2.8 Logging Account (http://en.wikipedia.org/wiki/logging.).
27
Wikipedia. (2007). Logging. Available: http://en.wikipedia.org/wiki/logging. Last accessed 20
September 2007.
|
 31
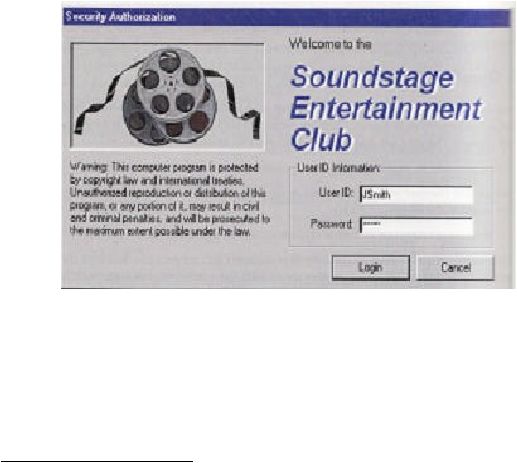
2.9.2 Authentication
According to Satzinger, Jackson
28
, Burd authentication is the process of
identifying users to verify that he or she can have access to the system.
Authentication is the basis of all security because if the user is incorrectly
identified, the security control will be useless. In many operating systems,
authentication requires the user to enter a user name and password. The user is
authe nticated if the password of his or her has
matched to the password that
is
stored in the security database.
Figure 2 9
.9
Authentication Log -In screen (Bentley, Whitten
pg.86).
28
Satzinger, Jakson, Burd (2004). Systems Analysis and Design in a Changing World. 3rd ed.Boston:
Thomson Course Technology. p608.
|
 32
Figure 2.10 Authentication
error screen (Bentley, Whitten
pg.86)
2.9.3 Password
According to webopedia.com²
9
,
password
is a secret series of character that enables
a
user to access a file, computer, or program. On
multi- user systems, each user must
enter
his
or
her
password
before
the
computer
will
respond
to
the commands.
Sometimes, the password can help to ensure that unauthorized user
cannot gain
access to the computer. Regularly,
the password is
made easy to remember, such as
their name or their initial, and should be something that nobody could guess.
2.10 Gantt chart
According to Bentley and Whitten³
0
,
Gantt chart
is
a
simple
horizontal
bar
chart
that depicts project task against a calendar. Each bar represents a na med project
task. The advantage of Gantt charts
is
that it
clearly shows the
overlapping tasks
(more than one task can be performed at the same time).
29
Webopedia.
(2007). password . Available: http://webopedia.com/TERM/P/password.html . Last accessed
20 September 2007.
30
Bentley, Whitten (2007). Systems Analysis and Design for the Global Enterprise. 7th ed. America,New
York: McGraw-Hill.
P125
|
|
33
2.11 Cost benefit Analysis
According to Satzinger, Jackson and Burd³¹
,
cost bene fit analysis is the analysis to
compare costs and benefits to see whether investing in the development of a new
system will be beneficial. There are three steps to developing a cost and benefit
analysis:
1. Estimating the
anticipated
development
and
operational
cost.
Development costs are those that
incur during
the development of the
new system. Operational costs are those that
incur after the system is
put into production.
2. Estimating
the
anticipated
financial
benefits. Financial
benefits
are
the
expected
annual
savings or
the
increase
in
revenue derived
from
the installation of the new system.
3. Calculating based on the detailed estimates of all the costs and
benefits.
Mostly,
the
inexperienced
analyst acquires
frequent
error
during
cost/benefit
analysis in trying to
do
the
calculations before
carefully defining the costs and benefits.
31
Satzinger, Jakson, Burd (2004). Systems Analysis and Design in a Changing World. 3rd ed.Boston:
Thomson Course Technology. P94.
|
|
34
2.11.1 Payback period
According to Satzinger, Jackson and Burd³²
,
payback period is a
method that
is
used by the organization to determine whether an investment will be
beneficial.
The payback period is
sometimes referred to
as
the breakeven
point. It is the point in time at which the
increased of cash
flow
will exactly
pay off the cost of development and operation.
2.11.2 Return on Investment
According to Bentley and Whitten
33
, Return on Investment (ROI) is a
technique that compares lifetime profitability
of
alternative
solution.
34
The
objective of ROI is to calculate a percentage return (like interest rate) so that
the cost and the benefit are exactly equal over the specified time period.
2.12 Interview
According
to
ergonomics4schools.com³
5
,
an interview
is
a
specialized
type
of
communication,
usually verbal, between two or
more people
and
is
carried
out
for a
specific purpose.
It is different from an ordinary conversation
in
that
its
form and purpose is structured. Interview is the primary data collection technique
32
Satzinger, Jakson, Burd (2004). Systems Analysis and Design in a Changing World. 3rd ed.Boston:
Thomson Course Technology. P97.
33
Bentley, Whitten (2007). Systems Analysis and Design for the Global Enterprise. 7th ed. America,New
York: McGraw-Hill.
P425
34
Satzinger, Jakson, Burd (2004). Systems Analysis and Design in a Changing World. 3rd ed.Boston:
Thomson Course Technology. P98.
35
Magdalen Galley. (2004).
Interview. Available:
Last accessed 24 September 2007.
|
|
35
for gathering data in qualitative methodologies. It is vary based on the number of
interview
conducted
during
the research,
the
number
of
people
involved
during
the
interviews, the level of structure and the proximity of the interviewer to the
participant. Certain interviews are conducted individually or in group. It also can
be conducted face-to- face with the benefits of being able to observe and record
non-verbal as well as
verbal behavior.
However,
interview can be conducted by
phone or online. It offers the opportunity to conduct more interviews within the
same time frame and draw participants from a wider geographic area.
2.13 Questionnaire
According
to
Cooper
and
Schindler³
6
,
questionnaire
is
an instrument delivered to
the
participants
or
respondents
via
personal
(intercept,
phone)
or
non-personal (computer
delivered,
mail-delivered)
means
that
is completed by the participants or respondents.
There are three categories of measurement questions that a questionnaire should contain:
Administrative questions
It
identifies
the
respondent,
interviewer,
interviewer
location, and
conditions. These questions are infrequently asked to the participant, but
are required for studying patterns within the data.
36
Donald R. Cooper, Pamela S. Schindler (2006). Business Research Method .9th ed. New York:
McGraw Hill. P363,364
|
|
36
Classification questions
Typically, it provides sociological-demographic variables that are
allowed in grouping the respondent’s answers. These questions frequently
emerge at the end of survey.
Target questions
It
addresses the
investigative
questio ns
of
a
specific
study and can be
grouped by topic in the survey. Target questions might be structured
(present the participant with a fixed set of choices) or unstructured
(no
limit in responses but
provide a
frame of
reference
for participant’s
answers).
37
Types of Questionnaire
There are two formats for questionnaire:
1. Free format
This
format
is designed
to
allow
the
users
to
have
more
freedom
in
answering each question.
2. Fixed format
This format is stiffer because it requires the user to select an answer from
a
predefined set of possible answers.
37
Bentley, Whitten (2007). Systems Analysis and Design for the Global Enterprise. 7th ed. America, New
York : McGraw-Hill. P221.
|