122
Section
Frekuensi
Downtime
Frekuensi
Downtime (%)
Frekuensi
Kumulatif
Cold Section
50.50
89.11%
89.11%
Hot Section
2.92
5.15%
94.26%
Mirror Section
1.58
2.79%
97.05%
Figured Glass
1.67
2.95%
100.00%
56.67
100.00%
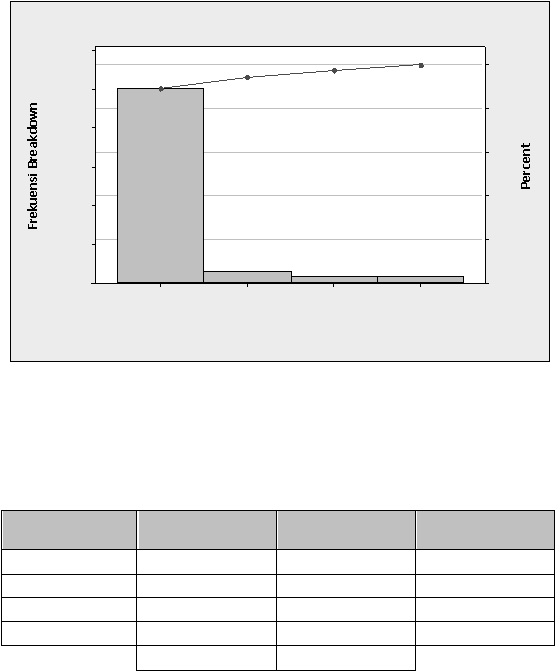
Gambar 5.1 dibawah ini menunjukan pareto dari kerusakan seluruh section.
Diagram Pareto Breakdown Seluruh Section
60
50
40
30
20
10
100
80
60
40
20
0
Section
Cold Section
Hot Section
Figured Glass
0
Mirror Section
Count
50.17
2.92
1.67
1.58
Percent
89.0
5.2
3.0
2.8
Cum %
89.0
94.2
97.2
100.0
Gambar 5.1 Diagram Pareto Breakdown Seluruh Section
Tabel
5.2
dan
Gambar
5.2
menunjukan
jumlah downtime
yang
terjadi
pada
seluruh section.
Tabel 5.2 Jumlah Downtime Seluruh Section
Total