|
9
CHAPTER
2
THEORITICAL
FOUNDATION
2.1 History of Fiber Optic Communication
Optical
communication
systems date back
two
centuries,
to
the
“optical
telegraph” invented by French engineer Claude Chappe in the 1790s. His system was
a
series of semaphores mounted on towers, where human operators relayed messages from
one tower to the next. It beat hand-carried
messages
hands down, but by the
mid-19th
century it was replaced by the electric telegraph, leaving a scattering of “telegraph hills”
as its most visible legacy.
Alexander Graham
Bell patented an optical telephone system,
which he called
the Photophone, in 1880, but his earlier invention, the telephone, proved far more
practical.
He
dreamed
of
sending
signals
through
the
air,
but the atmosphere did not
transmit light as reliably as wires carried electricity. In the decades that followed, light
was used for a few special applications, such as signaling between ships, but otherwise
optical communications, such as the experimental P hotophone Bell donated to the
Smithsonian Institution, languished on the shelf.
In the intervening years, a new technology that would ultimately solve the
problem of optical transmission slowly took root, although it was a long time before it
was adapted for communications. This technology depended on the phenomenon of total
internal
reflection, which can confine light
in a material surrounded by other
materials
with lower refractive index, such as glass in air.
|
 10
In
the
1840s,
Swiss
physicist
Daniel
Collodon and French physicist Jacques
Babinet
showed
that
light
could
be
guided
along
jets
of
water
for
fountain
displays.
British physicist John Tyndall popularized light guiding in a demonstration the first used
in 1854, guiding light in a jet of water flowing from a tank. By the turn of the century,
inventors realized that bent quartz rods could carry
light and patented them as dental
illuminators. By the 1940s, many doctors used illuminated Plexiglas tongue depressors.
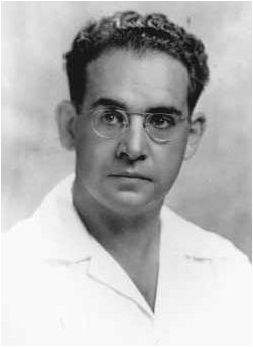
Figure 2.1.1 Heinrich Lamm
Optical fibers went a step further. They are essentially transparent rods of glass
or plastic stretched to be long and flexible. During the 1920s, John Logie Baird in
England and Clarence W. Hansell
in the United States patented the
idea of using arrays
of hollow p ipes or transparent rods to transmit images for television or facsimile
systems. However, the first person known to have demonstrated image transmission
through a bundle of optical
fibers was Heinrich
Lamm (Figure 2.1.1), then a medical
|
 11
student in Munich.
His goal was to look inside inaccessible parts of the body, and in a
1930 paper he reported transmitting the image of a light bulb filament through a short
bundle. However, the unclad fibers transmitted images poorly, and the rise of the Nazis
forced
Lamm, a Jew, to move to America and abandon his dreams of becoming a
professor of medicine.
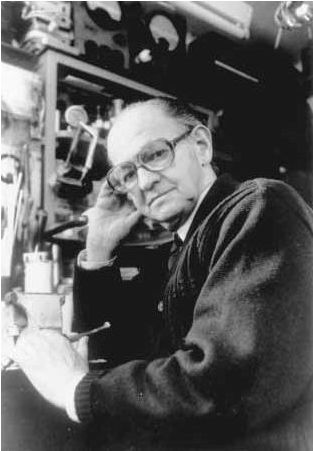
Figure 2.1.2 Holger Møller Hansen.
In
1951,
Holger Møller
Hansen
(Figure 2.1.2)
applied
for
a
Danish
patent
on
fiber optic imaging. However, the Danish patent office denied his application, citing the
Baird and Hansell patents, and Møller Hansen was unable to interest companies in his
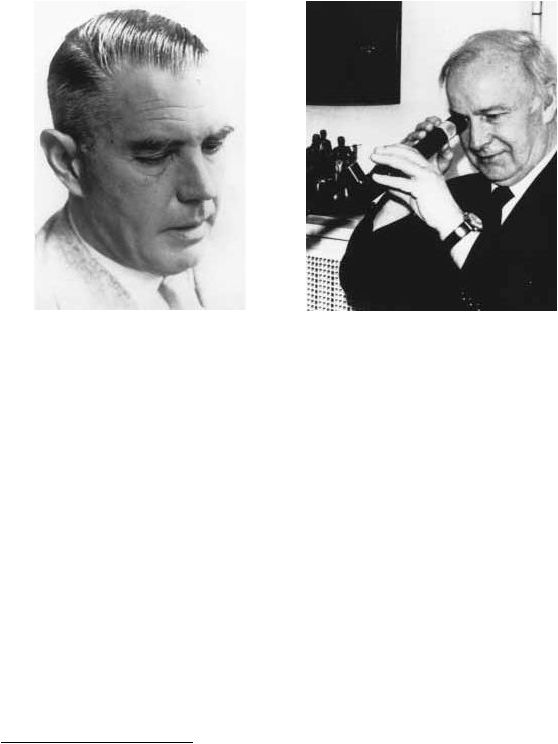
invention. Nothing more was reported on fiber bundles until 1954, when Abraham van
Heel
(Figure
2.1.3),
of
the
Technical
University
of
Delft
in Holland,
and
Harold
H.
|
 12
Hopkins (Figure 2.1.4) and Narinder Kapany, of Imperial College in London, separately
announced imaging bundles in the prestigious British journal Nature.
Figure 2.1.3 Abraham C. S. van Heel
Figure 2.1.4 Harold H. Hopkins
Neither van Heel
nor Hopkins and Kapany made bundles that could carry
light
far,
but
their
reports
began
the
fiber
optics
revolution[
2
].
The
crucial
innovation
was
made
by
van
Heel,
stimulated
by
a
conversation
with
the
American
optical
physicist
Brian O’Brien (Figure 2.1.5). All earlier fibers were bare, with total internal reflection at
a glass-air interface. Van Heel covered a bare fiber of glass or plastic with a transparent
cladding
of
lower
refractive
index.
This
protected
the
total-reflection surface
from
contamination and greatly reduced crosstalk between fibers.
2
Nature: British Journal.
|
 13
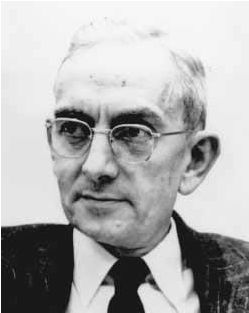
Figure 2.1.5 Brian O’Brien
The next key step was development of glass-clad
fibers
by
Lawrence Curtiss
(Figure 2.1.6) , then an undergraduate at the University of Michigan working part-time
on a project with physician Basil Hirschowitz
(Figure 2.1.7) and
physicist C. Wilbur
Peters to develop an endoscope to examine the inside of the stomach (Figure 2.1.8). Will
Hicks, then working at the American Optical Co.,
made
glass-clad
fibers at
about
the
same time, but his group lost a bitterly contested patent battle. By 1960, glass-clad fibers
had attenuation of about one decibel per meter, fine for medical imaging, but much too
high for communications.
|
 14
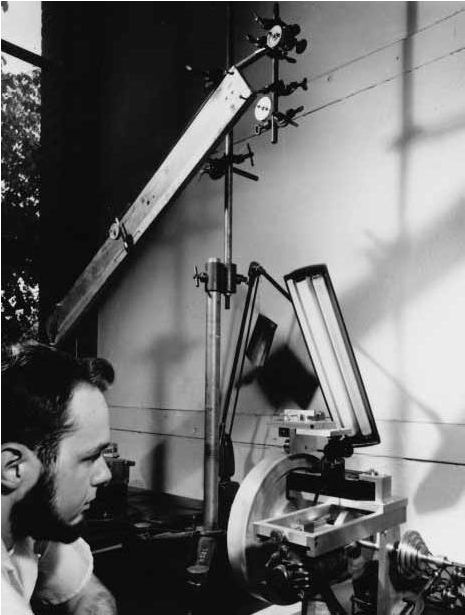
Figure 2.1.6 Lawrence Curtiss, with the equipment he used to make glass-clad
Fibers
|
 15
Figure 2.1.7 Basil Hirschowitz
Figure 2.1.8 Prototype fiber optic endoscopes made by Lawrence
Curtiss, Wilbur Peters, and Basil Hirschowitz
Meanwhile, telecommunications engineers were seeking more transmission
bandwidth. Radio and microwave frequencies were in heavy use, so engineers looked to
higher frequencies to carry the increased loads they expected with the growth of
television and telephone traffic.
Telephone companies thought
video telephones lurked
|
|
16
just around the corner and would escalate bandwidth demands even further. On the
cutting edge of communications research were millimeter wave systems, in which
hollow pipes served as waveguides to circumvent poor atmospheric transmission at tens
of gigahertz, where wavelengths were in the millimeter range.
Even higher optical frequencies seemed a logical next step in 1958 to Alec
Reeves, the forward- looking engineer at Britain’s Standard Telecommunications
Laboratories, who invented digital pulse-code
modulation before World War II. Other
people climbed on the optical communications bandwagon when the laser was invented
in
1960.
The
July
22,
1960,
issue
of
Electronics
introduced its report on Theodore
Maiman’s demonstration of the first laser by saying,
“Usable communications channels
in
the electromagnetic spectrum
may be extended by development of an experimental
optical- frequency amplifier.”
[3]
Serious work on optical communications had to wait for the CW
helium
neon
laser. While air is far more transparent to
light at optical wavelengths than to
millimeter
waves, researchers soon found that rain, haze, clouds, and atmospheric turbulence
limited the reliability of long-distance atmospheric laser links. By 1965, it was clear that
major
technical
barriers
remained
for
both
millimeter wave
and
laser
telecommunications.
Millimeter
waveguides
had
low
loss,
although
only
if they
were
kept precisely straight; developers thought the biggest problem was the lack of adequate
repeaters. Optical
waveguides were proving to be a problem. Stewart Miller’s group at
Bell Telephone Laboratories was working on a system of gas lenses to focus laser beams
along
hollow waveguides
for
long-distance telecommunications.
However,
most
of
the
telecommunications industry thought the future belonged to millimeter waveguides.
3
Electronics, an American trade journal
|
 17
Optical fibers had attracted some attention because they were analogous in
theory to plastic dielectric waveguides used in certain microwave applications. In 1961,
Elias
Snitzer
at
American
Optical,
working with Hicks at Mosaic Fabrications (now
Galileo
Electro-Optics),
demonstrated
the
similarity
by
drawing
fibers
with
cores
so
small they carried light in only one waveguide mode. However, virtually everyone
considered fibers too lossy for communications; attenuation of a decibel per meter was
fine for looking inside the body, but communications operated over much longer
distances and required loss of no more than 10 or 20 decibels per kilometer.
One small group did not dismiss fibers so easily—a
team
at
Standard
Telecommunications Laboratories (STL), initially headed by Antoni E. Karbowiak, that
worked under Reeves to study optical waveguides for communications. Karbowiak soon
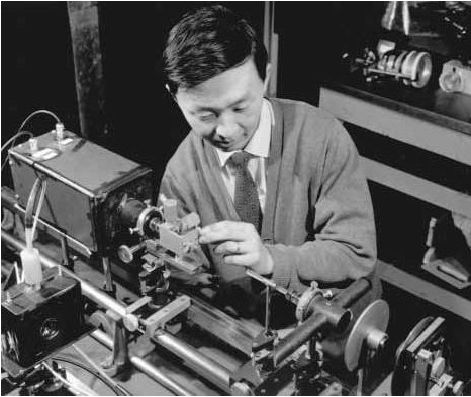
was joined by a young engineer born in Shanghai, Charles K. Kao (Figure 2.1.9).
Figure 2.1.9 Charles K. Kao
|
|
18
Kao took a long, hard look at fiber attenuation. He collected samples from fiber
makers, and carefully investigated the properties of bulk glasses. His research convinced
him that the high losses of early fibers were due to impurities, not to silica glass itself. In
the midst of this research, in December 1964, Karbowiak left STL to become chair of
electrical engineering at the University of New South Wales in Australia, and Kao
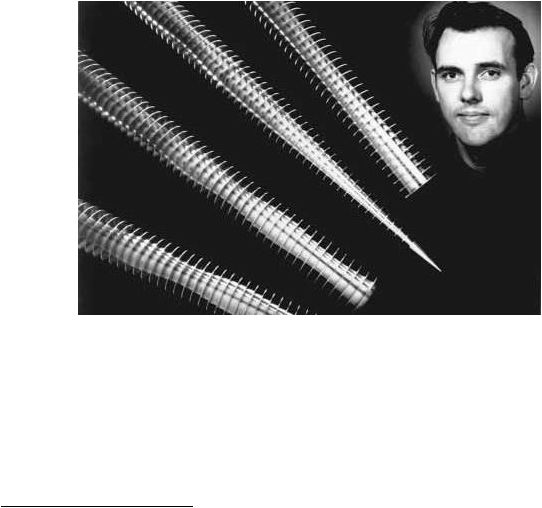
succeeded him as manager of optical communications research. With George Hockham
(Figure 2.1.10),
another
young STL
engineer
who
specialized
in antenna
theory, Kao
worked
out
a
proposal
for
long-distance communications over singlemode fibers.
Convinced
that
fiber
loss
should
be reducible
below
20 decibels
per
kilometer,
they
presented a paper at a London meeting of the Institution of Electrical Engineers (IEE).
The April 1, 1966, issue of Laser Focus noted Kao’s proposal:
At the IEE meeting in London last month, Dr. C. K. Kao observed that
short-distance runs have shown that the experimental optical waveguide
developed by Standard Telecommunications Laboratories has an
information-
carrying
capacity . .
.
of
one
gigacycle,
or equivalent
to
about 200 tv channels or more than 200,000 telephone channels. He
described STL’s device as consisting of a glass core about three or four
microns in diameter, clad with a coaxial layer of another glass having a
refractive index about one percent smaller than that of the core. Total
diameter of the waveguide is between
300
and
400
microns.
Surface
optical waves are propagated along the interface between the two types
of glass. According to Dr. Kao, the fiber is relatively strong and can be
easily supported. Also, the guidance surface is protected from external
influences.
.
.
.
the
waveguide
has
a
mechanical
bending
radius
low
enough to make the fiber almost completely flexible. Despite the fact that
the
best
readily
available
low-loss
material
has
a
loss
of
about
1000
|
 19
dB/km, STL believes that materials having losses of only tens of decibels
per kilometer will eventually be developed.
[4]
Kao and Hockham’s detailed analysis was published in the July 1966,
Proceedings
of
the
Institution
of
Electrical
Engineers. Their daring
forecast that
fiber
loss could be reduced below 20 dB/km attracted the interest of the British Post Office,
which then operated
the British telephone network. F.F. Roberts, an engineering
manager at the Post Office Research Laboratory (then at Dollis Hill in London), saw the
possibilities and persuaded
others
at
the Post
Office.
His
boss,
Jack
Tillman, tapped
a
new research fund of 12 million pounds to study ways to decrease fiber loss.
Figure 2.1.10 George Hockham
With Kao almost evangelically promoting the prospects of fiber
communications, and the Post Office interested in applications, laboratories around the
world began trying to reduce
fiber
loss. It took four
years to reach Kao’s goal of 20
4
Laser Focus World
|
 20
dB/km, and the route to success proved different than many had expected. Most groups
tried to purify the compound glasses used for standard optics, which are easy to melt and
draw into fibers. At the Corning Glass Works (now Corning, Inc.), Robert Maurer,
Donald Keck, and Peter Schultz (Figure 2.1.11) started with fused silica, a material that
can
be
made extremely pure, but has a
high
melting point and a low refractive
index.
They made cylindrical preforms by depositing purified materials from the vapor phase,
adding carefully controlled levels of dopants to make the refractive index of the core
slightly
higher than that of the cladding, without raising attenuation dramatically. In
September
1970,
they announced
they
had
made singlemode
fibers with
attenuation
at
the 633- nanometer (nm) helium neon line below 20 dB/km. The fibers were fragile, but
tests at the new
British Post Office
Research Laboratories
facility
in
Martlesham Heath
confirmed the low loss.
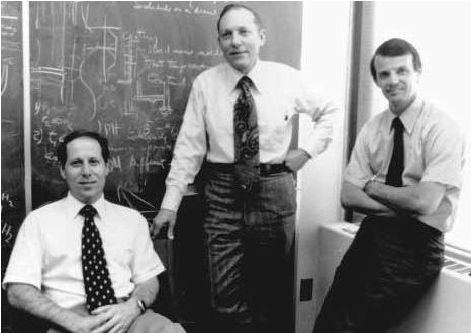
Figure 2.1.11 Donald Keck, Robert Maurer, and Peter Schultz (left to right)
|
|
21
The Corning breakthrough was among the most dramatic of many developments
that opened the door to fiber optic communications. In the same year, Bell Labs and a
team at the Loffe Physical Institute in Leningrad (now St. Petersburg) made the first
semiconductor diode lasers able to emit carrier waves (CW) at room temperature. Over
the next several years, fiber losses dropped dramatically, aided both by improved
fabrication methods and by the shift to longer wavelengths where fibers have inherently
lower attenuation.
Early
singlemode
fibers
had
cores
several
micrometers
in
diameter and
in
the
early 1970s that bothered developers. They doubted it would be possible to achieve the
micrometer-scale tolerances needed to couple
light efficiently into the tiny cores from
light sources or in splices or connectors. Not satisfied with the low bandwidth of
step-
index multimode fiber, they concentrated on multimode fibers with a refractive-index
gradient between core and cladding, and core diameters of 50 or 62.5 micrometers. The
first generation of telephone field trials in 1977 used such fibers to transmit light at 850
nm from gallium-aluminum arsenide laser diodes.
Those
first-generation
systems
could
transmit
light
several
kilometers
without
repeaters, but were limited by loss of about 2 dB/km in the fiber. A second generation
soon
appeared,
using
new
indium
gallium
arsenide
phosphate
(InGaAsP) lasers that
emitted at 1.3 micrometers, where fiber attenuation was as low as 0.5 dB/km, and pulse
dispersion was somewhat lower than at 850 nm. development of hardware for the first
transatlantic
fiber cable
showed
that
single
mode
systems
were
feasible,
so
when
deregulation opened the long-distance phone market in the early 1980s, the carriers built
national backbone systems of single
mode fiber with 1300-nm sources. That technology
|
|
22
has spread into other telecom applications and remains the standard for most fiber
systems.
However, a new generation of singlemode systems is now beginning to find
applications in submarine cables and systems serving large numbers of subscribers.
They operate at 1.55 micrometers, where fiber loss is 0.2 to 0.3 dB/km, allowing even
longer repeater spacing. More important, erbium-doped optical fibers can serve as
optical amplifiers at
that wavelength, avoiding
the
need for electro-optic regenerators.
Submarine cables with optical amplifiers can operate at speeds to 5 gigabits per second
and can be upgraded from lower speeds simply by changing terminal electronics. Optical
amplifiers also are attractive for fiber systems delivering the same signals to many
terminals, because the
fiber amplifiers can compensate for losses in dividing the signals
among many terminals.
The biggest challenge remaining for
fiber optics
is economic. Today telephone
and cable television companies can cost justify installing fiber links to remote sites
serving tens to a few hundreds of customers. However, terminal equipment remains too
expensive to justify installing fibers all the way to homes, at least for present services.
Instead, cable and phone companies run twisted wire pairs or coaxial cables from optical
network units to individual homes. Time will see how long that lasts.
|
|
23
2.2 Basic of Fiber Optic Communications
Optical fiber is the medium in which communication signals are transmitted from
one location to another in the form of light guided through thin fibers of glass or plastic.
These signals are digital pulses or continuously modulated analog streams of light
representing information. These can be voice information, data information, computer
information, video information, or any other type of information.
These same types of
information can be sent on
metallic wires such as twisted
pair and coax and through the air on microwave frequencies. The reason to use optical
fiber
is
because
it
offers
advantages
not
available
in
any
metallic
conductor or
microwaves.
The
main
advantage of optical
fiber
is
that
it
can
transport
more
information
longer distances in less time than any other communications medium. In addition, it is
unaffected by the interference of electromagnetic radiation, making it possible to
transmit information and data with less noise and less error. There are also many other
applications for optical fiber that are simply not possible with metallic conductors. These
include sensors/scientific applications, medical/surgical applications,
industrial
applications, subject illumination, and image transport.
Most optical fibers are made of glass, although some are made of plastic. For
mechanical protection, optical fiber is housed inside cables. There are many types and
configurations of cables, each for a specific application: indoor, outdoor, in the ground,
underwater, Deep Ocean, overhead, and others.
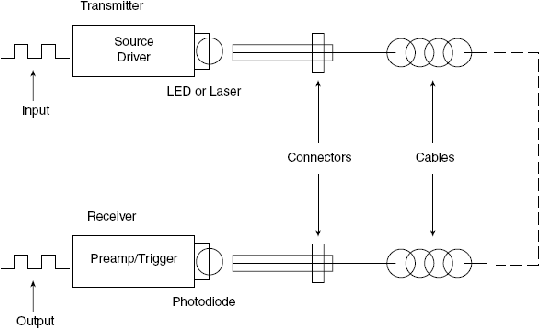
An optical fiber data link is made up of three elements (Figure 2.2.1):
|
 24
1. A light source at one end (laser or light-emitting diode [LED], including a
connector or other alignment mechanism to connect to the fiber. The light source
will receive its signal from the support electronics to convert the electrical
information to optical information.
2. The fiber (and its cable, connectors, or splices) from point to point. The fiber
transports this light to its destination.
3. The light detector on the other end with a connector interface to the fiber. The
detector
converts
the
incoming
light
back
to
an
electrical
signal,
producing
a
copy of the original electrical input. The support electronics will process that
signal to perform its intended communications function.
The
source and detector
with their
necessary support electronics are called the
transmitter and receiver, respectively.
Figure 2.2.1 a typical fiber optic data link.
|
 25
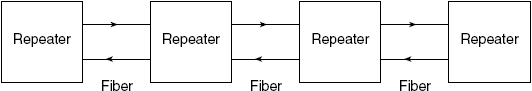
Figure 2.2.2 Long distance data links require repeaters to regenerate signals.
In long-distance systems (Figure 2.2.2) the use of intermediate amplifiers may be
necessary to compensate for
the signal
loss
over the
long
run of the
fiber.
Therefore,
long-distance networks will be comprised of a number of identical links connected
together. Each repeater consists of a receiver, transmitter, and support electronics.
|
 26
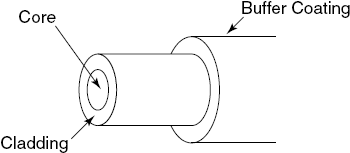
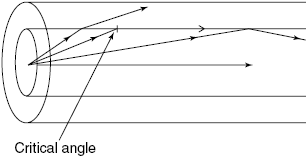
2.2.1 Optical Fiber
Optical fiber (Figure 2.2.3) is comprised of a light-carrying core surrounded by a
cladding that traps the light
in the core by the principle of total internal reflection. By
making the core of the fiber of a material with a higher refractive index, we can caus e
the
light in
the core to be
totally
reflected at the boundary of the cladding for all
light
that strikes
at greater than a critical angle. The critical angle is determined by the
difference in the composition of the materials used in the core and cladding. Most
optical fibers are made of glass, although some are made of plastic. The core and
cladding are usually fused silica glass covered by a plastic coating, called the buffer, that
protects the glass
fiber
from physical damage and
moisture. Some all-pla stic
fibers are
used for specific applications. Glass optical fibers are the most common type used in
communication applications. Glass optical fibers can be
single mode
or multimode.
Most of today’s telecom and community antenna television (CATV) systems
use single
mode fibers, whereas local area networks (LANs) use multimode graded- index fibers.
Figure 2.2.3 Optical Fiber Construction
Singlemode fibers are smaller in core diameter than multimode fibers and offer
much greater bandwidth, but the larger core size of multimode fiber makes coupling to
|
|
27
low cost sources such as LEDs much easier. Multimode fibers may be of the step-index
or graded- index design. Plastic optical fibers are large core step- index multimode fibers,
although graded-index plastic fiber is under development. Because plastic fibers have a
large diameter and can be cut with simple tools, they are easy to work with and can use
low-cost connectors.
Plastic
fiber
is
not
used
for
long
distance
because
it
has
high
attenuation
and
lower bandwidth
than glass
fibers.
However, plastic optical fiber
may be
useful
in the
short runs from the street to the home or office and within the home or office. There are
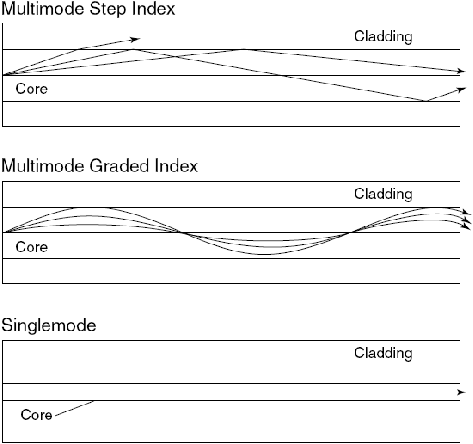
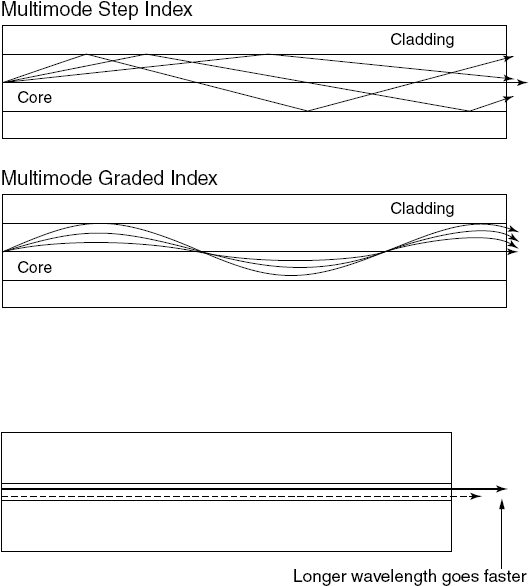
two basic types of optical
fiber—multimode and singlemode (Figure 2.2.4). Multimode
fiber means that light can travel many different paths (called modes) through the core of
the fiber, entering and leaving the fiber at various angles. The highest angle that light is
accepted into the core of the fiber defines the numerical aperture (NA).
|
 28
Figure 2.2.4 The three types of optical fiber.
|
 29
Two types of multimode fiber exist, distinguished by the index profile of their cores and
how light travel in them (Table 2-1).
Fiber Type
Core/Cladding
Diameter (m)
Attenuation
850nm
Coefficient
1300n m
(dBkm)
1550nm
Bandwidth
(MHz-km)
Multimode/Plastic
Multimode/Step
Index
Multimode/
Graded Index
Single mode
1
mm
200/240
50/125
62,5/125
85/125
100/140
8-9/125
(1dB/m
6
3
3
3
3
@665nm)
1
1
1
1
0,5
0,3
Low
50@850nm
600@1300nm
500@1300nm
500@1300nm
300@1300nm
high
Table 2.1 Fiber Types and Typical Specifications
Step-index multimode fiber has a core composed completely of one type of glass.
Light travels in straight lines in the fiber, reflecting off the core/cladding interface. The
NA is determined by the difference in the indices of refraction of the core and cladding
and can be calculated by Snell’s law. Since each mode or angle of light travels a
different path, a pulse of light is dispersed while traveling through the fiber, limiting the
bandwidth of step-index fiber.
In
graded- index multimode fiber, the core is composed of many different layers
of glass, chosen with indices of refraction to produce an index profile approximating a
parabola, where from the center of the core the index of refraction gets lower toward the
cladding. Since light travels faster in the lower index of refraction glass, the light will
travel faster as it approaches the outside of the core. Likewise, the light traveling closest
to
the
core
center
will
travel
the
slowest. A
properly
constructed
index
profile
will
|
|
30
compensate for the different path lengths of each mode, increasing the bandwidth
capacity of the fiber by as much as 100 times over that of step- index fiber.
Single
mode
fiber just shrinks the core size
to a
dimension
about six
times
the
wavelength of light traveling in the fiber and it has a smaller difference in the refractive
index of the core and cladding, causing all the light to travel in only one mode. Thus
modal dispersion disappears and the bandwidth
of the fiber increases tremendously over
graded-index fiber.
2.2.2 Fiber Manufacture
Three methods are used today to fabricate moderate-to- low loss waveguide
fibers: modified chemical vapor deposition (MCVD), outside vapor deposition (OVD),
and vapor axia l deposition (VAD).
|
 31
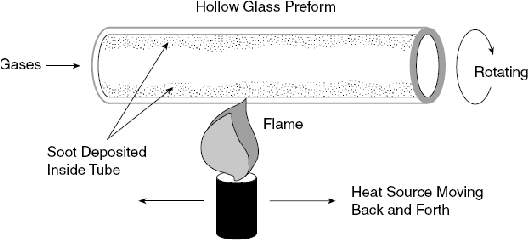
2.2.2.1 Modified Chemical Vapor Deposition (MCVD)
In MCVD a hollow glass tube, approximately 3 feet long and 1 inch in diameter
(1
m
long
by
2.5
cm
diameter),
is
placed
in
a
horizontal or
vertical
lathe
and
spun
rapidly. A computer-controlled mixture of gases is passed through the inside of the tube.
On the outside of the tube, a heat source (oxygen/hydrogen torch) passes up and down as
illustrated in Figure 2.2.5.
Each pass of the heat source fuses a small amount of the precipitated gas mixture
to the surface of the tube. Most of the gas is vaporized silicon dioxide (glass), but there
are carefully controlled remounts of impurities (dopants) that cause changes in the index
of refraction of the glass. As the torch moves and the preform spins, a layer of glass is
formed
inside
the
hollow
preform.
The
dopant
(mixture
of
gases)
can
be
changed
for
each layer so that the index may be varied across the diameter.
After sufficient
layers are built up, the tube
is collapsed into a solid
glass rod
referred to as a preform. It is now a scale model of the desired fiber, but much shorter
and thicker. The preform is then taken to the drawing tower, where it is pulled into a
length of fiber up to 10 kilometers long.
Figure 2.2.5 Modified chemical vapor deposition (MCVD).
|
 32
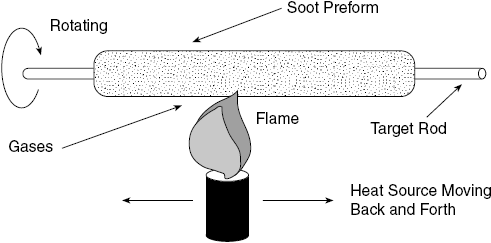
2.2.2.2 Outside Vapor Deposition (OVD)
The OVD method utilizes a glass target rod that is placed in a chamber and spun
rapidly on
a
lathe.
A
computer-controlled mixture of gases is then passed between the
target rod and the heat source as illustrated in Figure 2.2.6. On each pass of the
heat source, a small amount of the gas reacts and fuses to the outer surface of the rod.
After enough layers are built up, the target rod is removed and the remaining soot
preform is collapsed into a solid rod. The preform is then taken to the tower and pulled
into fiber.
Figure 2.2.6 Outside vapor deposition (OVD).
|
 33
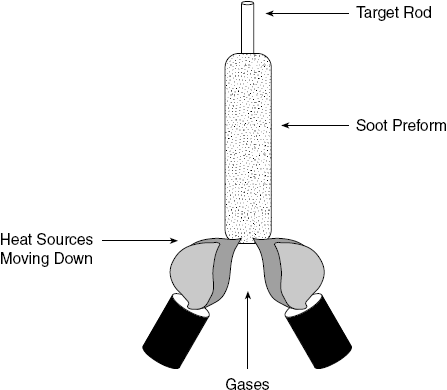
2.2.2.3 Vapor Axial Deposition (VAD)
The VAD process utilizes a very short
glass target rod suspended by one end. A
computer-controlled mixture of gases is applied between the end of the rod and the heat
source as shown in Figure 2.2.7.
The
heat source
is
slowly backed off as the preform
lengthens due to tile soot buildup caused by gases reacting to the heat and fusing
to the
end of the rod. After sufficient length is formed, the target rod is removed from the end,
leaving the soot preform. The preform is then taken to the drawing tower to be heated
and pulled into the required fiber length.
Figure 2.2.7 Vapor axial deposition (VAD).
|
 34
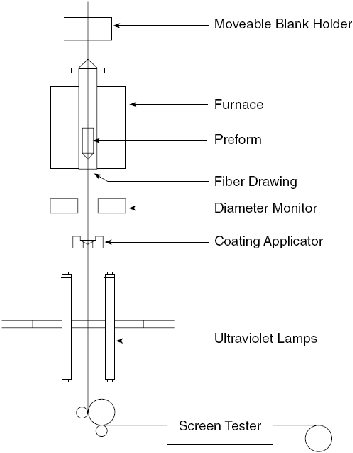
2.2.2.4 Coating the Fiber for Protection
After the fiber is pulled from the preform, a protective coating is applied very
quickly after the formation of the hair-thin fiber (Figure 2.2.8). The coating
is necessary
to provide mechanical protection and prevent the ingress of water into any fiber surface
cracks. The coating typically is made up of two parts, a soft inner
coating and a harder outer coating. The overall thickness of the coating varies between
62.5 and 187.5 µm, depending on fiber applications.
Figure 2.2.8 Drawing the fiber from the preform and coating the fiber.
These coatings are typically strippable by mechanical means and must be removed
before fibers can be spliced or connectorized.
|
 35
2.2.2.5 What is Index of Refraction?
The index of refraction of a material is the ratio of the speed of light in vacuum
to that in the material. In other words, the index of refraction is a measure of how much
the
speed
of
light
slows
down after
it
enters
the
material.
Since
light
has
tis highest
speed in vacuum, and since light slows down whenever it enters any medium (water,
plastic, glass, crystal, oil, etc.), the index of refraction of all media is greater than one.
For example, the
index of refraction
in a vacuum
is 1,
that of glass and plastic optical
fibers is approximately 1.5, and water has an index of refraction of approximately 1.3
When light goes from one material to another of a different index of Refraction,
its path will bend, causing an illusion similar to the “bent” stick stuck into water. At its
limits, this phenomenon is used to reflect the light at the core/cladding boundary of the
fiber and trap it in the core (Figure 2.2.9). By choosing the material differences between
the
core and cladding,
one
can
select
the
angle of
light
at
which this
light
trapping,
called total
internal reflection, occurs.
This angle defines a primary
fiber specification,
the numerical aperture.
Figure 2.2.9 Total internal reflection in an optical fiber.
|
|
36
2.2.2.6 Fiber Application
Each type of fiber has its specific application. Step-index multimode fiber is used
where
large
core
size
and
efficient
coupling
of
source
power
are more important
than
low
loss and
high bandwidth. It
is commonly used in short,
low-speed datalinks. It may
also be
used
in applications
where radiation
is a concern, since
it can be
made with
a
pure silica core that is not readily affected by radiation.
Graded- index
multimode fiber
is
used for data communications systems where
the transmitter sources are LEDs. While fo ur graded- index multimode fibers have been
used over the history of fiber optic communications, one fiber now is by far the most
widely used by virtually all multimode datacom networks—62.5/125 µm.
The telephone companies use singlemode fiber for its better performance
at
higher bit rates and its lower loss, allowing faster and longer unrepeated links for long-
distance telecommunications. It is also used in CATV, since today’s analog CATV
networks
use
laser sources designed
for singlemode fiber and
future CATV
networks
will use compressed digital video signals. Almost all other highspeed networks are using
singlemode fiber, either to support gigabit data rates or long-distance links.
|
|
37
2.2.2.7 Fiber Performance
Purity of the medium is very important
for best transmission of an optical signal
inside the fiber. Perfect vacuum is the purest medium we can have in which to transmit
light. Since all optical fibers are made of solid, not hollow, cores, we have to settle for
second best in terms of purity.
Technology makes it possible for us to make glass very
pure, however.
Impurities are the unwanted things that can get into the fiber and become a part
of its structure. Dirt and impurities are two different things. Dirt comes to the fiber from
dirty hands and a dirty work environment. This can be cleaned off with alcohol wipes.
Impurities, on the other hand, are built into the fiber at the time of manufacture; they
cannot be cleaned off.
These impurities will cause parts of optical signal to be lost due to scattering or
absorption causing attenuation of the signal. If we have too many impurities in the fiber,
too much of the optical signal will be lost and what is left over at the output of the fiber
will not be enough for reliable communications.
Much of the early research and development of optical fiber centered on methods
to make the fiber purity higher to reduce optical losses. Today’s fibers are so pure that as
a point of comparison, if water in the ocean was as pure, we would be able to see the
bottom on a sunny day.
Optical glass fiber has another layer (or two) that surrounds the cladding, known
as the buffer. The buffer is a plastic coating(s) that provides scratch protection for the
glass below. It also adds to the
mechanical strength of the
fiber and protects it from
moisture damage
|
|
38
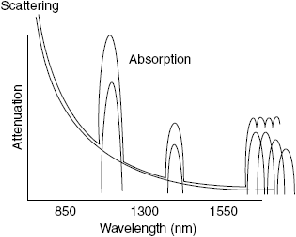
2.2.2.8 Fiber Attenuation
The
attenuation
of
the
optical
fiber
is a
result
of
two
factors—absorption and
scattering
(Figure
2.2.10). Absorption is caused by the absorption of the light and
conversion
to
heat by
molecules
in the
glass. Primary absorbers are
residual OH+ and
dopants used to modify the refractive index of the glass. This absorption occurs at
discrete wavelengths, determined by the elements absorbing the light. The OH+
absorption
is predominant,
and
occurs
most
strongly
around
1000
nm,
1400
nm,
and
above 1600 nm.
The largest cause of attenuation is scattering. Scattering occurs when light
collides with individual atoms in the glass and is anisotrophic. Light that is scattered at
angles
outside
the
critical angle of the fiber will be absorbed into the cladding or
scattered in all directions, even transmitted back toward the source. Scattering is also a
function of
wavelength, proportional
to
the
inverse
fourth power of the wavelength of
the
light.
Thus,
if
you
double
the
wavelength
of
the
light,
you
reduce
the
scattering
losses by 24 or 16 times. Therefore, for long distance transmission, it is advantageous to
use the longest practical wavelength for minimal attenuation and maximum distance
between repeaters. Together, absorption and scattering produce the attenuation curve for
a
typical glass optical fiber shown in Figure 2.2.10.
Fiber
optic systems transmit in the windows created between the absorption
bands at 850 nm, 1300 nm, and 1550
nm,
where physics also allows one to fabricate
lasers and detectors easily. Plastic fiber has a more limited wavelength band that limits
practical use to 660-nm LED sources.
|
 39
Figure 2.2.10 Fiber
loss mechanisms.
2.2..9 Fiber Bandwidth
Fiber’s
information transmission capacity
is limited by two separate components
of
dispersion:
modal (Figure
2.2.11)
and chromatic (Figure
2.2.12). Modal dispersion
occurs in step- index multimode fiber where the paths of different modes are of varying
lengths.
Modal
dispersion
also comes
from
the
fact
that
the
index
profile
of
graded-
index
multimode
fiber
is
not
perfect.
The
graded- index
profile
was
chosen
to
theoretically allow all modes to have the same group velocity or transit speed along the
length of the fiber. By making the outer parts of the core a lower index of refraction than
the inner parts of the core, the higher order modes speed up as they go away from the
center of the core, compensating for their longer path lengths.
|
 40
Figure
2.2.11 Modal dispersion, caused by different path lengths in the fiber, is corrected in graded-index
fiber.
Figure
2.2.12 Chromatic dispersion occurs because light of different colors
(wavelengths) travels at different speeds in the core of the fiber.
In an
idealized graded- index fiber, all modes
have the same
group velocity and
no modal dispersion occurs.
But
in
real
fibers,
the
index
profile
is
a
piecewise
approximation and all modes are not perfectly transmitted, allowing some modal
dispersion. Since the higher-order
modes
have greater deviations, the modal dispersion
|
|
41
of a fiber (and therefore its laser bandwidth) tends to be very sensitive to modal
conditions in the fiber. Thus the bandwidth of longer fibers degrades nonlinearly as the
higher-order modes are attenuated more strongly.
The
second factor in fiber bandwidth is chromatic dispersion. Remember, a
prism spreads out the spectrum of incident light since the light travels at different speeds
according to its color and is therefore refracted at different angles. The usual way of
stating
this
is
the
index
of
refraction of
the glass
is
wavelength
dependent.
Thus, a
carefully manufactured graded- index multimode fiber can only be optimized for a single
wavelength, usually near 1300 nm, and light of other colors will suffer from chromatic
dispersion.
Even
light
in the same mode
will be dispersed if
it
is of different
wavelengths.
Chromatic dispersion is a bigger problem with LEDs, which have broad spectral
outputs, unlike lasers that concentrate most of their light in a narrow spectral range.
Chromatic dispersion occurs with LEDs because
much of the power is away
from the
zero dispersion
wavelength of
the fiber. High-speed systems
such as Fiber
Distributed
Data Interface (FDDI), based on broad output surface emitter LEDs, suffer such intense
chromatic dispersion that transmission over only 2 kilometer of 62.5/125 fiber can be
risky.
|
|
42
2.3 Fiber Optic Technology
The aim of this chapter is to present a framework of different Fiber Optic. The
framework
includes
the
network
architecture,
the
multiplexing methods and the data
protocols used.
These networks are expected to handle voice, video and data services as well as
new and evolving applications. Different choices and compromises can be made so that
services and service providers can effective ly share the network. Fiber Optic technology
is
still
being
refined and developed
--
optimal
architectures
and
technologies
are still
being debated. A dominant technology for Fiber Optic has not yet emerged. The current
technical
and
market
literature about
Fiber
Optic has
focused
on
the
network
architecture and data protocols. The current debate is largely focused on Ethernet over
Active Star, Asynchronous Transfer Mode (ATM) over Passive Optical Network (PON)
and Ethernet over PON architectures. The use of
Dense
Wavelength
Division
Multiplexing (DWDM) over PON is being considered for future local access networks.
However, the architecture and protocols do not capture the full extent of
differences
between
implementations
of Fiber
Optic
networks.
A
discussion
of
multiplexing
methods needs to be
included. Multiplexing determines
network sharing
--
the choice in how and where to multiplex the data determines how upstream and
downstream traffic and traffic
from different subscribers, providers and different
services share the network. Therefore, the issue of open access should be considered
in
the context of how traffic is multiplexed on the network.
|
|
43
2.3.1 Fiber Optic Technology
A fiber optic link consists of the following basic components: a transmitter,
optical fiber and a receiver. The transmitter and receiver contain both electrical and
optical components.
The optical transmitter takes
information such as
voice, video or
data
in electrical
form,
modulates
it
and
uses a
light
source,
such as
a
light
emitting
diode (LED) or laser to convert electrical signals into optical form (light). The optical
signal is then transmitted over the optical fiber to the receiver.
The information is delivered through the optical fiber over one or more
wavelengths, also referred to as carriers. One light source is used per wavelength. Lasers
typically operate at wavelengths of 1310 nanometers (nm) or 1550 nm, depending on the
number
of
wavelengths
driven
over the
fiber.
There are
two
types
of
fiber:
multimode
and single mode. Single mode fiber has a longer range and higher capacity then
multimode fiber because it is
less subject to attenuation and dispersion of the optical
signal. However it is more expensive than multimode fiber.
The
receiver
contains
a
photo-detector
that
recognizes
the
signal.
The
receiver
then demodulates and converts the optical signal back into an electrical form. Depending
on the type of data, the signal may be converted further into the original format (often
analog).
A
transceiver
is
equipment
that
combines the functions of a transmitter and
receiver.
A
Fiber Optic
network
is terminated at
either end by an optical line terminator
(OLT) or an optical networking unit (ONU). The OLT resides in the carrier aggregation
point, referred to in this thesis as the meet point. “Meet point” is meant as a general term
to describe the carrier premise or hub located in each community. The meet
|
|
44
point is where service providers interconnect with the local access network. In telephone
systems, the meet point is the central office. In cable television networks, the meet point
is known as the head end. The meet point may also be a carrier neutral collocation point.
The Optical Line Terminator (OLT) resides in the meet point and connects the service
providers’ transport network(s) with the local access network. The OLT multiplexes and
converts the service providers’ traffic and transmits optical signals on the local network.
The OLT receives
and de- multiplexes
the
upstream subscriber
traffic
from
the
local
access
network.
It
implements MAC protocols for media access arbitration in
coordination
with
the
ONUs.
The
OLT
is
equivalent
to
the
Cable
Modem
Terminal
Server
(CMTS)
in
an
HFC
network
and
the
DSL
Access
Multiplexer
(DSLAM)
in
a
DSL network.
The Optical Networking Unit (ONU) resides in the subscriber premise. It may be
attached to the outside of the house or reside inside the house (typically in the garage or
basement). The ONU provides the connection between the access network and the home
network. Home networks usually consist of twisted copper pair and/or coax wiring. The
ONU receives and de- multiplexes the providers’ downstream traffic. The ONU converts
the subscriber’s upstream traffic and transmits it on the local access network. The ONU
may
multiplex data
from multiple
sources in the home (voice, Internet traffic) onto the
fiber link. Sometimes the ONU performs only the optical functions and the higher- level
protocol functions are performed by a residential gateway. The residential gateway is
similar
to
a
cable
modem
used
in
HFC
networks or a
DSL
modem. Other
times,
both
types of functionality are handled by the same piece of equipment.
|
|
45
2.3.2 Multiplexing
Multiplexing is a technique in which information from different sources is combined for
transmission onto one communications
line
or
in
the
case
of
fiber,
onto
a
single
wavelength.
A
multiplexer combine’s
data
signals
at
the
transmitting
end
of
the
communications
link. A demultiplexer separates out
the
individual signals at the
receiving end. Table 2.2 shows examples of
how multiplexing is used to share different
types of data traffic in Fiber Optic systems. This list is not meant to be exhaustive, but
show
how
current
designs of Fiber
Optic
use different
multiplexing techniques. The
multiplexing
techniques
include:
Space Division Multiplexing (SDM),
Wave Division
Multiplexing
(WDM)
and
Time
Division
Multiplexing
(TDM). These
multiplexing
techniques are complementary; fiber networks typically use a combination of these
techniques
|
 46
Multiplexing Options
Sources of Data Traffic
Two Way
Transmission
Subscribers
Services
Providers
Space Division Multiplexing
Wire per upstream
and downstream
Home Run
Coax for video,
Fiber for Data
and Video
Home Run,
provider own
facilities
Wave Division
Multiplexing
Coarse
WDM
1
wave for
upstream and
downstream
1
wave per
subscriber
1
wave for video
and 1 wave
for
data and service
1
wave per
provider
Dense
WDM
TDMA
channel per
subscriber
Fixed Time
Division
Multiplexing
Fixed
TDMA Channel
per upstream and
downstream
Statistical
ATM, IP
VoIP, Switched
Digital
Video,
Voice and Video
over ATM
QoS,
ATM/MPLS,
Source Based
Routing,
Tunneling,
Ethernet VLAN
Table 2.2 Multiplexing Methods Used in Fiber Optic
|
 47
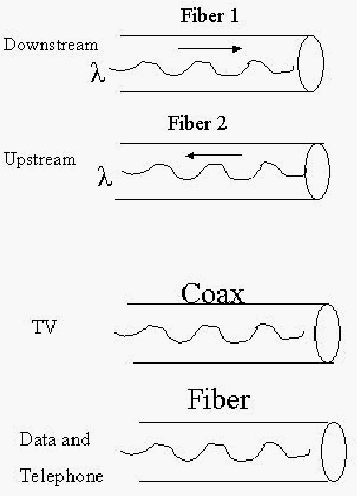
2.3.2.1. Space Division Multiplexing
Space
Division
Multiplexing transmits data across separate physical network
links--
each data signal is sent over a separate wire or
fiber. For example, some
Fiber
Optic systems deploy two
fibers to each subscriber premise as shown
in
figure
2.2.13.
One
fiber
is
used
to
transmit downstream
traffic and one to
transmit
upstream
traffic.
Some systems deploy both coaxial cable and
fiber using the coaxial cable to
transmit
analog cable TV and the fiber to transmit data and telephone traffic. See figure 2.2.14.
Figure
2.2.13 Space
Division Multiplexing: Wire per Upstream/Downstream
Path
Figure 2.2.14 Space Division Multiplexing:
Wire per Type of Service
|
 48
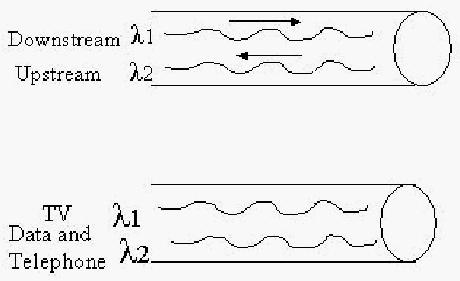
2.3.2.2. Wave Division Multiplexing
Wave Division Multiplexing (WDM) transmits data across separate wavelengths on a
single physical link. The data signals are combined onto an optical fiber, with a separate
light wavelength carrying its own signal. This is also known as frequency division
multiplexing (FDM). Coarse Wavelength Division Multiplexing (CWDM) transmits
signals across two to four wavelengths over a single fiber. Some systems use two
separate wavelengths for transmitting traffic in different directions (Figure 2.2.15) or for
transmitting different types of data (Figure 2.2.16).
Figure
2.2.15 Coarse Wave Division Multiplexing (CWDM): Wavelength per Downstream/Upstream
Signal
Figure 2.2.16
Coarse Wave Division Multiplexing (CWDM): Wavelength per Type of Service
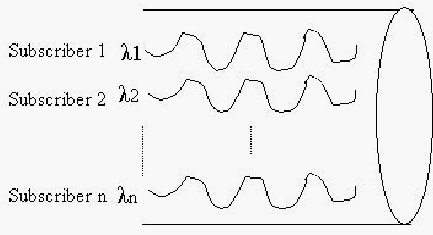
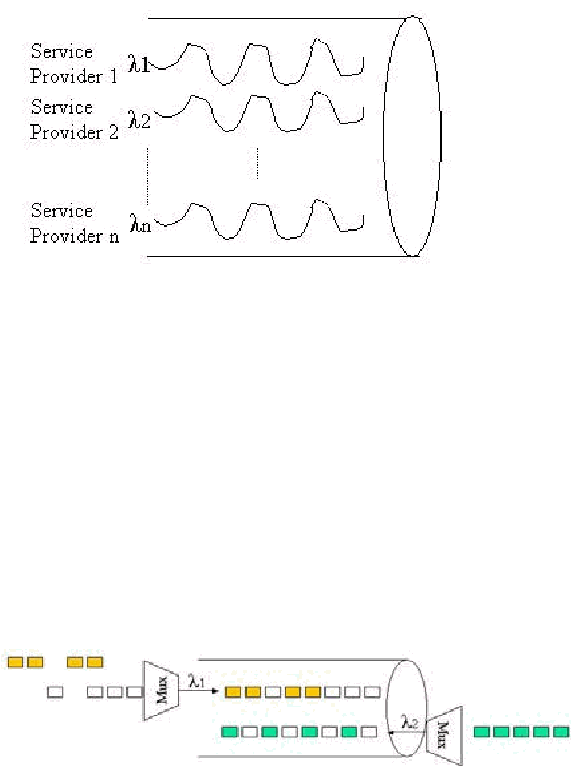
Dense Wavelength Division Multiplexing (DWDM) combines many (at least
four or more)
individual
wavelengths of light over a single fiber link. In a Fiber Optic
system, a wavelength may carry traffic belonging to a particular subscriber (Figure
2.2.17) or service provider (Figure 2.2.18). Currently DWDM technology multiplexes up
to 80 separate wavelengths on a single fiber and this capability continues to grow.
|
 49
Therefore potentially up to 200 Gbps (billion bits per second) can be delivered a
second by the optical fiber with each wavelength carrying 2.5 Gbps. DWDM is used
predominantly
in
long
haul
backbone
networks,
although it is starting to be used in
metropolitan area networks. For the foreseeable future (5 years or more), DWDM will
probably not be used within local access networks because of its costs. currently there is
not enough traffic to justify
DWDM within the local access network. The cost of the
DWDM equipment is shared over only a few subscribers (up to 64 currently) rather than
over millions in a backbone network.
Figure
2.2.17 Dense WDM (DWDM): Wavelength per Subscriber
|
 50
Figure 2.2.18 Dense WDM (DWDM): Wavelength per Provider a.k.a. “Spectrum Unbundling”
2.3.2.3. Time Division Multiplexing
Time Division Multiplexing transmits data on a single wavelength using separate
timeslots
for
the
different
signals.
The
signal
is
broken up
into
many
timeslots,
each
having a very short duration. See Figure 2.2.19. Fixed TDM pre-assigns the timeslots so
bandwidth is allocated to each channel regardless of whether the station has data to
transmit. Statistical TDM dynamically assigns timeslots so that bandwidth is allocated
only
to active
input channels, a
more efficient
use of available bandwidth. The
ATM
protocol is an example of statistical multiplexing.
Figure
2.2.19 Time Division Multiplexing:
Statistical TDM for Downstream and Fixed TDMA for
Upstream
|
|
51
2.4 Research Method
There are several steps involved in my research:, Diagnosing, problem analysis,
Solution designing, Evaluation, Specific learning.
All of the steps are sequential and
connect one to another. My researches are qualitative
in nature and need to examine the
research by using qualitative techniques. Below I will explain the detail of each method.
Diagnosing is the first step in my research. Diagnosing are
identifying and
defining the problem that is to be solved. Before do the research about the topic, First we
have to know and understand deeply about the topic. We also have to define the scope,
constraint, and other important parts of
the problem.
In this part also, we can
analyze
whether we capable to do the research. Based on the reference searching we do in this
part.
After deeply knew and
understand about the
topic, we can proceed to the next
stage, which is problem analysis. In this step we gather all the
information that we find
before and group it to
choose several solutions to become our
solution candidate. Then
we analyze the
solution
from
several
aspects.
For
example:
from
the
advantage and
disadvantage. This argument will help us to choose one solution that becomes our main
solution in the next part.
Third part is the solution design.
In
this part, we
have to pick one of
the best
solutions for our research based on the analysis. And then choose the best way to
implement our proposed solution. We
have to
make the
implementation of our solution
to be good and it have capability proof to solve the problem.
After create a solution and implement it, we can observe the
implemented
solution. What
is the outcome of
it? If
it’s
good, then we have to prove
it by using
a
|
|
52
factual or logical proof. It is not good to create an argument without a logical proof. If
we already proved it to be a good solution and give several logical proof to support our
solution, it means our solution is the best solution.
And the last step is the specific learning. In this phase we are using the
observations
gained
in
the Evaluation stage to create a model describing the overall
situation being researched. And then analyzed it to
get the conclusion about the whole
research. We can also add our idea about future research, if we interested to continued
our research about the problem in the future.
|