100
A
25
20
B
9
8.5
C
Main
Effects Plot
(data means) for
y
51.5
50.5
49.5
48.5
47.5
A
B
C
Gambar
2.35 Output Graph Window: Main Effects Plot
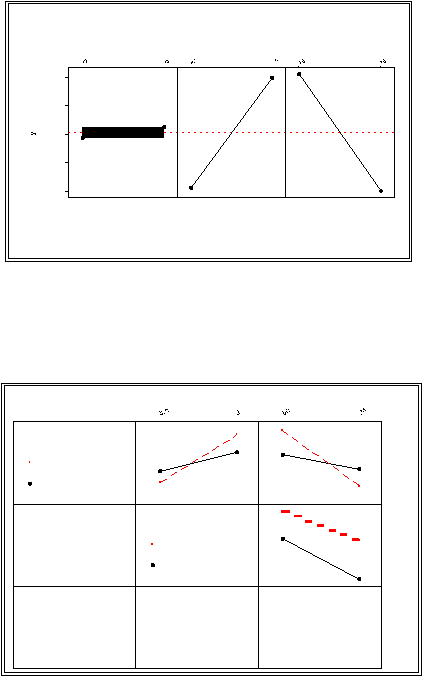
Interaction Plot (data means) for y
53
49
45
53
49
45
Gambar
2.36 Output Graph Window: Interaction Plot