17
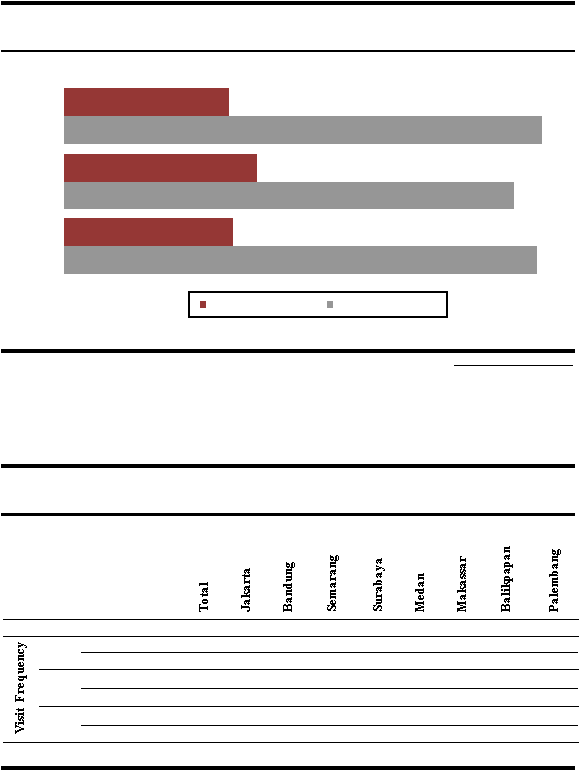
Graph 2.1.12:
Comparison of Visit Frequency between weekends and working
days (%)
once
twice
>
twice
25.7
30.0
26.4
74.3
70.0
73.6
Working days
Weekends
Source: MARS Indonesia
Graphic
2.1.12
shows
that
most
of
Indonesian
citizens
do
their
shopping
during
the
weekends
Table 2.1.13: Comparison of Visit Frequency between Working days and
Weekends based on City (%)
Comparison of Visit
Frequency between Working
Days and Weekends
1x
Working Days
25.7
22.8
40.3
26.3
29.2
26.2
27.0
30.4
13.9
Weekends
74.3
77.2
59.7
73.7
70.8
73.8
73.0
69.6
86.1
2x
Working Days
30.0
44.3
20.5
9.8
24.2
20.2
4.5
8.6
20.9
Weekends
70.0
55.7
79.5
90.2
75.8
79.8
95.5
91.4
79.1
> 2x
Working Days
26.4
25.2
13.6
53.3
36.8
35.8
23.5
55.8
16.9
Weekends
73.6
74.8
86.4
46.7
63.2
64.2
76.5
44.2
83.1
Source: MARS Indonesia
Table 2.1.13 Shows that around 75% of
Indonesian citizens
visit shopping
malls during
the weekends.