16
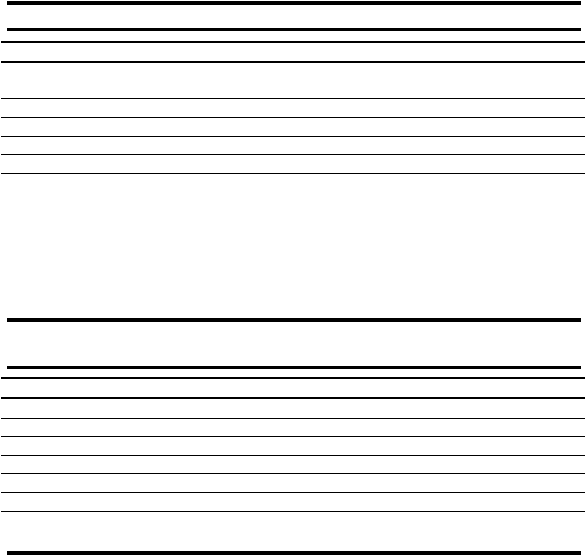
Table 2.1.10: Frequency of Visit in the last month based on Age (%)
Total
Age groups
Frequency
18 - 25 years
26 - 34 years
35 -
55 years
2x/month
25.9
28.3
26.6
21.5
3x/month
10.4
13.4
9.8
7.0
4x/month
7.7
8.9
7.5
6.6
>
4x/month
2.6
4.4
1.7
1.4
Table 2.1.10. Shows that the younger their age ranges the more frequently people go to
shopping
malls
and the older
their age range
the
more rarely
they
go to
shopping
malls.
It shows that young Indonesian people like to socialize in the mall
Table 2.1.11 : Frequency of Visit in the last month based on Social-Economic Status
(%)
Total
SES
Frequency
A B
C
D & E
1x/month
53.4
49.9
50.4
54.2
62.7
2x/month
25.9
24.7
29.4
26.8
21.9
3x/month
10.4
15.0
7.5
9.5
6.0
4x/month
7.7
7.0
7.9
8.4
7.2
>
4x/month
2.6
3.5
4.8
1.1
2.3
Source: MARS Indonesia
Table
2.1.11
shows
that
most
residents
across
different
social-economic
status
mostly
visited shopping malls only once a month.