15
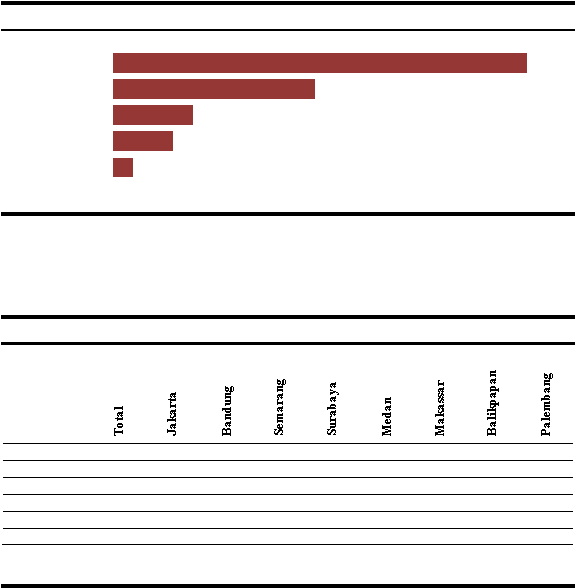
Graph 2.1.8: Frequency of Visit to Shopping Malls in the last month (%)
1x/month
2x/month
3x/month
4x/month
> 4x/month
2.6
10.4
7.7
25.9
53.4
Source: MARS Indonesia
Graph 2.1.8. Shows that 53.4% of Indonesian citizens go to shopping center only once a
month.
Table 2.1.9: Frequency of Visit in the last month based on City (%)
Frequency
1x/month
53.4
58.1
29.7
58.1
39.0
70.3
58.3
47.3
59.6
2x/month
25.9
22.9
36.2
23.8
30.9
24.0
21.4
34.6
26.4
3x/month
10.4
10.9
14.7
8.4
12.0
4.9
8.8
12.1
3.3
4x/month
7.7
5.9
18.1
6.5
10.1
0.5
10.0
3.5
8.8
>
4x/month
2.6
2.3
1.2
3.2
7.9
0.3
1.5
2.5
1.9
Source: MARS Indonesia
Table
2.1.9.
Shows
58.1%
of
Jakarta
residents
visit
shopping
mall
once
a
month
and
22.9% of them visit shopping mall twice a month.