14
Table 2.1.6: Distribution of Indonesian Consumers based on Social-Economic Class
(%)
Social Economic Status
Amount of Expenditure (IDR)
%
E
< IDR 600,000
10.3
D
IDR 600,000 – 900,000
16.7
C
IDR 900,001 – 1,750,000
47.7
B
IDR 1,750,001 – 2,500,000
11.0
A
> IDR 2,500,000
14.3
Source: MARS Indonesia
Table
2.1.6.
Shows
that
most
of
Indonesian
citizens
are
in
status
C,
which
means
that
their expenditure amounts between IDR 900,001 to IDR 1,750,000 per month.
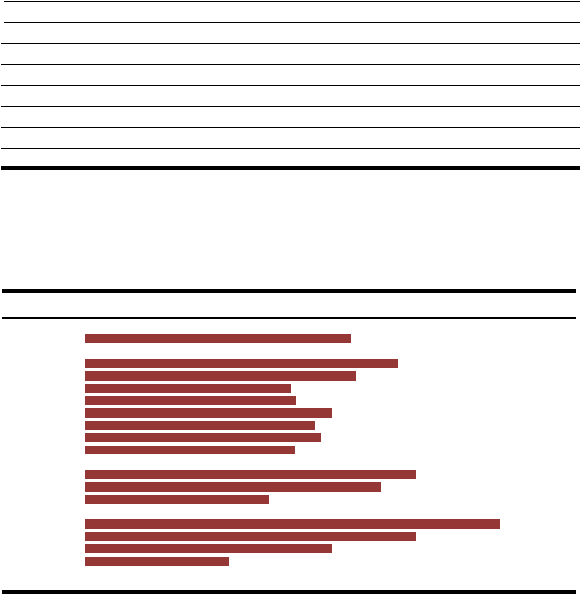
Graph 2.1.7: Visit to Shopping Malls in the last month (%)
Total
43,0
Jakarta
Bandung
Semarang
Surabaya
Medan
Makassar
33,3
34,1
37,1
40,1
43,8
50,6
Balikpapan
Palembang
34,1
38,1
18 - 25 tahun
26 - 34 tahun
35 - 55 tahun
29,8
47,9
53,6
A
B
C
D
&
E
Source: MARS Indonesia
23,3
40,0
53,6
67,2
Graph 2.1.7. Shows that 50.6% of Jakarta citizens visited shopping
malls in last one
month. 53.6% are in age group 18-25
years old and 67.2% are in A social class. These
groups of people are the target market of shopping malls