13
Banda Aceh
53.859
Medan
407.428
Padang
170.208
Pekanbaru
167.359
Jambi
107.370
Palembang
303.588
Bengkulu
66.241
Bandar Lampung
174.037
Pangkal Pinang
Jakarta
37.003
Serang
Denpasar
108.755
450.875
Mataram
84.637
Kupang
56.546
Pontianak
124.097
Palangkaraya
48.662
Banjarmasin
151.401
Balikpapan
137.705
Manado
103.561
Palu
65.285
Makassar
257.987
Kendari
57.006
Gorontalo
38.596
Ambon
55.112
Ternate
29.633
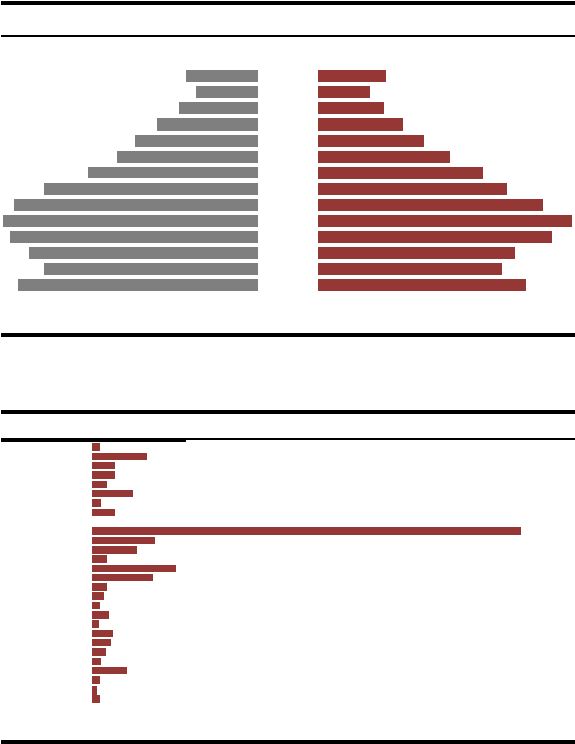
Graph 2.1.4: Distribution of Indonesian Consumers based on Age and Sex
Age
960.538
1.098.485
1.142.037
1.114.657
1.027.470
763.707
324.609
277.276
352.307
453.358
551.637
633.717
65+
60 - 64
55 - 59
50 - 54
45 - 49
40 - 44
35 - 39
30 - 34
25 - 29
20 - 24
15 - 19
10 - 14
335.478
259.760
327.738
418.797
520.062
649.277
815.633
931.611
1.110.456
1.250.838
1.155.483
973.079
958.358
5 - 9
908.261
1.077.138
Male
0 - 4
Female
1.025.479
Source: Central Bureau of Statistics
Graph 2.1.4. Shows
that
most of Indonesian citizens are
in their productive age, 20-24
years old.
Graph 2.1.5: Population of Households in Main Cities of Indonesia
Bandung
Semarang
Yogyakarta
Surabaya
467.893
329.544
105.716
625.534
3.199.886
Source: Central Bureau of Statistics processed by MARS
Graphic 2.1.5. Shows that Jakarta is occupied by the largest number of household
population.