20
l
A.
Net InvestmentReqrnred
(From Development Costs Wotk.sheet)
B.
Yearly
Cash
Flows: based on
five
12-morrt:hs periods follo ; .r:ing
of
the proposed system. Cash flow can be negative
Net
Economic Be11efit
Operating Co:r!: Reduction
=Pre-tax
Income
(-)
On-gcin.g
Elipeuse
from
worksheet
=Net Cash
Flow
YEARS
TOTAL
YEAR
1
YEAR2
YEAR3
YEAR4
YEARS
0
0
0
0
0
xxxxxx
m=xx
=
=
=
X:& :;;xx
""""""
=
=
=xxxx
Xl<XXX
xxxxx
xzxxx
xxzzx
xxxxxz
xxxxxx
nxxxx
:;::xxxzx
C. SimpLe ROl, cakulated as
B
I#-
YRS! A
D. Scoring,
F.conomic impact
Score
0
1
2
3
4
5
Simple
Retum
On Investment
zero or
less
1% to 299o/&
3000/c to
499%
501)% to
699%
700io/o
to
899%
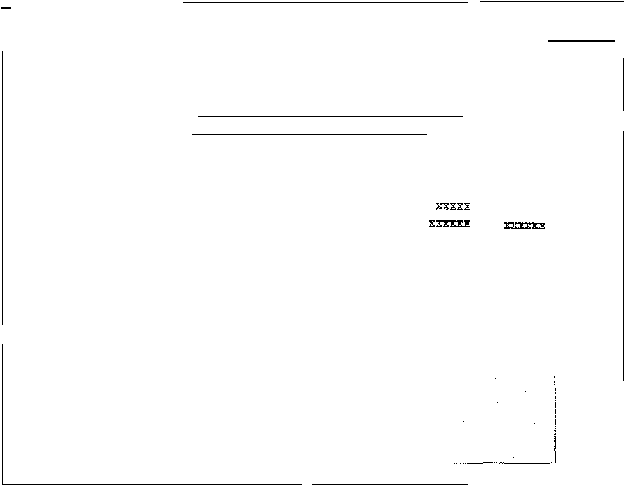
Gambar 2.5 Lembar Kelja Darnpak Ekonomis
(Sumber: Parker et
ill.,1988, p97)
Pe.rhitungan.
simple
ROI
didasarkan pada
analisis biaya-manfaat tr&d:isional yang
mencakup penghinclanm dan pemindallan
biaya (Parker et
ill.,
1988, pp101-102).
Tclrnik
analisis
haru
mcmrrut Parker mencalmp biaya
dan
manfaat
yang
terhitung
ditambah
de:n.garn
nilai. Tcknik
barn
inbersifat
menambah.
Teknik
yang digunakan adalah value
linking,
value acceleration,
value
restructuring,
dan innovation
valuation. Untuk lebih
jelas, liliat gambar 2.6 di lhawah
ini.