125
Gambar
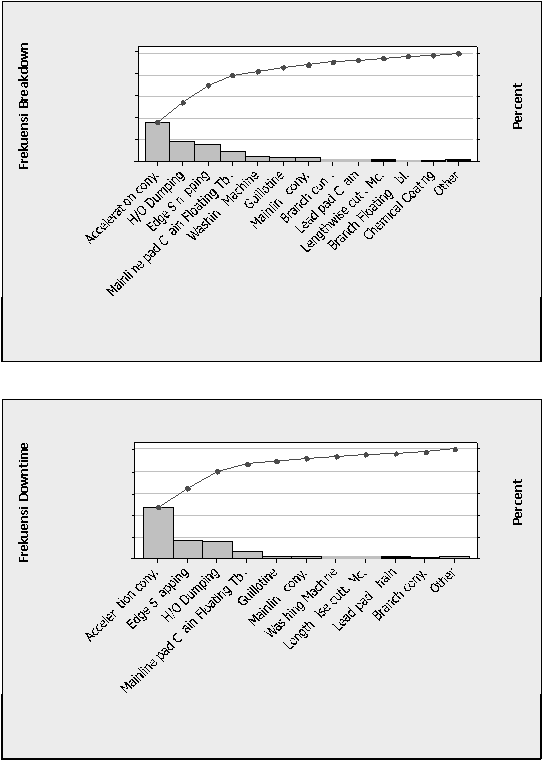
5.3
dan
5.4
menunjukan
diagram
pareto
dari
kerusakan
pada
mesin-
mesin section cold .
Mesin
Diagram Pareto Breakdown Cold Section
100
80
60
40
20
0
100
80
60
40
20
0
Count
36
18
15
9
4
3
3
2
2
2
1
1
2
Percent
37
18
15
9
4
3
3
2
2
2
1
1
2
Cum %
37
55
70
80
84
87
90
92
94
96
97
98
100
Gambar 5.3 Diagram Pareto Breakdown Cold Section
Mesin
Grafik Pareto Downtime Mesin Cold Section
50
40
30
20
10
0
100
80
60
40
20
0
Count
23.83 8.67
7.75
3.25 1.42
1.08
1.00
0.83
0.67
0.58
1.42
Percent
47.2 17.2
15.3
6.4 2.8 2.1 2.0
1.6 1.3
1.1
2.8
Cum %
47.2 64.4
79.7
86.1
89.0
91.1
93.1
94.7 96.0
97.2
100.0
Gambar 5.4 Diagram Pareto Downtime Cold Section