Dari hasil yang diperoleh melalui program SPSS, uji Kolmogrov-Sig. = 0,200
> 0,1 maka data berdistribusi
normal
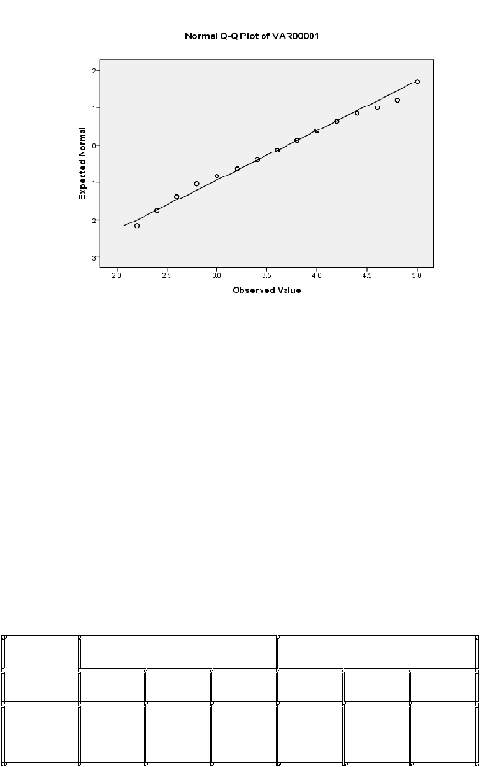
Gambar 4.6Grafik Normalitas Variabel Brand Image
Jika dilihat pada gambar 4.6 terlihat sebaran data variabel Brand Image(Y)
membuktikan bahwa sebaran titik-titik plot berada pada garis lurus yang artinya
bahwa variabel tersebut berdistribusi normal.
4.4.5.3 UjiNormalitas Perspective Customer (Variabel Z)
Tabel 4.10 Uji Normalitas Variabel Z
Tests of Normality
Kolmogorov-Smirnova Shapiro-Wilk
Statistic df Sig. Statistic df Sig.
VAR0000
1 .081 100 .106 .974 100 .041
a. Lilliefors Significance Correction