120
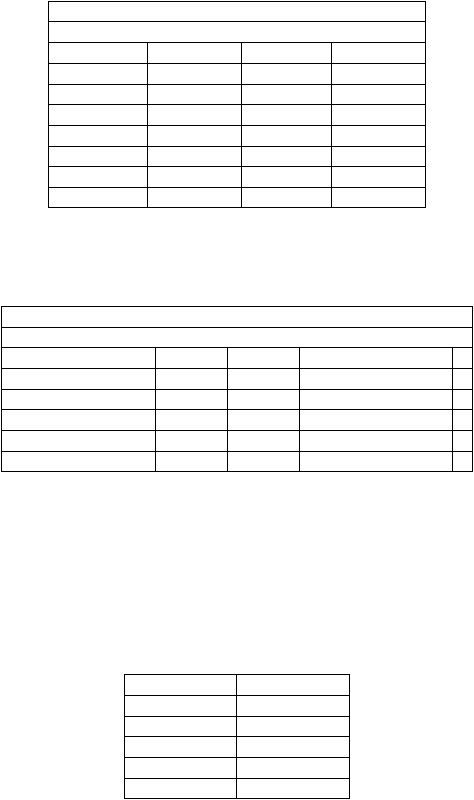
Tabel 4.88. Cost of Equity ATPK
ATPK
Cost of Equity
2010
2009
Ket
N
244
242
apendix a
CoVariance
-0,000008613
0,000283896
apendix a
Variance
0,000160359
0,000227926
apendix a
Return IHSG
43,80%
76,32%
a
ß
-0,053713188
1,245563056
b
SBI
6,64%
7,77%
c
Cost of Equity
4,64%
93,16%
c
+
(b x (a-c))
Sumber: SBI dan IHSG 2010 dan hitungan penulis
3. Mencari WACC
Tabel 4.89. WACC ATPK
ATPK
Weighted Cost of Capital
2010
2009
Keterangan
Cost of debt
1,87%
0,13%
a
Cost of Equity
4,64%
93,16%
b
Percent of debt
28,68%
0,14%
a
/
(a+b) x 100%
c
Percent of equity
71,32%
99,86%
b
/
(a+b) x 100%
d
WACC
3,85%
93,03%
(a x c) + (b x d)
Sumber: hitungan penulis
4. Mencari discounted cash flow.
Dasar
asumsi
pertumbuhan
ATPK
dengan
menggunakan
rata-rata
pertumbuhan
industri
perusahaan.
Detail
mencari
nilai
asumsi.
dilampirkan
di appendix
b.
Pertumbuhan
rata-rata ATPK dijabarkan sebagai berikut:
Tabel 4.90. Pertumbuhan
Rata-rata ATPK
2006 - 2010
sal
23,64%
op inc
0,00%
capex
27,37%
depre
25,39%
wc
59,61%
Sumber: hitungan penulis